
- Title
-
Behavioral Effects of Developmental Exposure to JWH-018 in Wild-Type and Disrupted in Schizophrenia 1 (disc1) Mutant Zebrafish
- Authors
- García-González, J., de Quadros, B., Havelange, W., Brock, A.J., Brennan, C.H.
- Source
- Full text @ Biomolecules
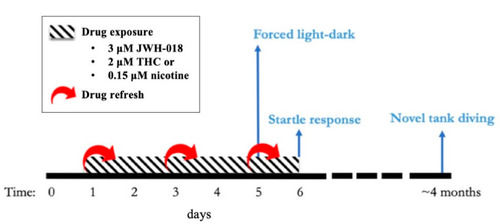
Experimental timeline for developmental exposure to 1-pentyl-3-(1-naphthoyl)indole (JWH-018), delta-9-tetrahydrocannabinol (THC), and nicotine. The behavioral tests performed are represented in light blue. |
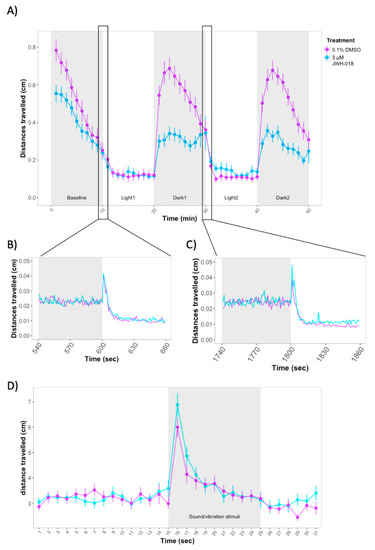
(A) Forced light/dark test in 5 days post fertilization (dpf) zebrafish larvae. Sample size: n = 64 for each dose group. Each dot represents mean distance travelled per minute. Error bars represent ± SEM. (B,C) One-second resolution plots of the transitions from dark to light during the forced light/dark test. (D) Response and habituation to acoustic startle in 6 dpf zebrafish larvae. Sample sizes: control: n = 87, JWH-018-treated: n = 81. Each dot represents mean distance travelled per second. Error bars represent ± SEM. PHENOTYPE:
|
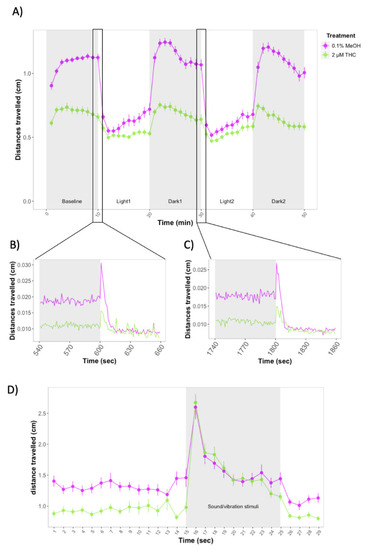
(A) Forced light/dark test in wild-type zebrafish exposed to 2 μM THC. Sample size: n = 48 for each dose group. Each dot represents the mean of the total distance travelled per minute. Error bars represent ± SEM. (B,C) One-second resolution plots of the transitions from dark to light during the forced light/dark test. (D) Distances travelled by control and THC-treated larvae before and after exposure to 10 sound/vibration stimuli. Figure shows mean distances travelled in one-second time bins. Each dot represents mean distance travelled per second.Error bars represent ± SEM. Sample sizes: n = 48 per dose group. PHENOTYPE:
|
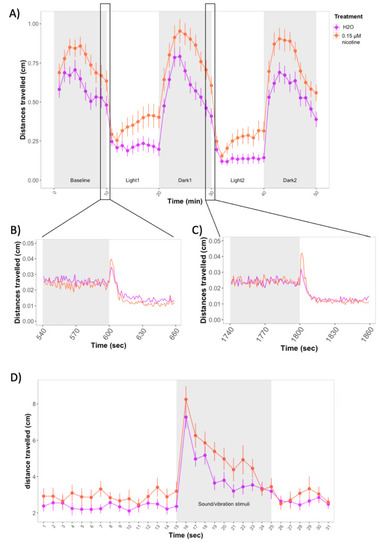
(A) Forced light/dark test in wild-type zebrafish exposed to 0.15 μM nicotine. Sample size: n = 48 for each dose group. Each dot represents the mean of the total distance travelled per minute. Error bars represent ± SEM. (B,C) One-second resolution plots of the transitions from dark to light during the forced light/dark test. (D) Distances travelled by control and nicotine-treated larvae before and after exposure to 10 sound/vibration stimuli. Figure shows mean distances travelled in one-second time bins. Each dot represents mean distance travelled per second. Error bars represent ± SEM. Control: n = 23, treated with 0.15 μM nicotine: n = 23. PHENOTYPE:
|
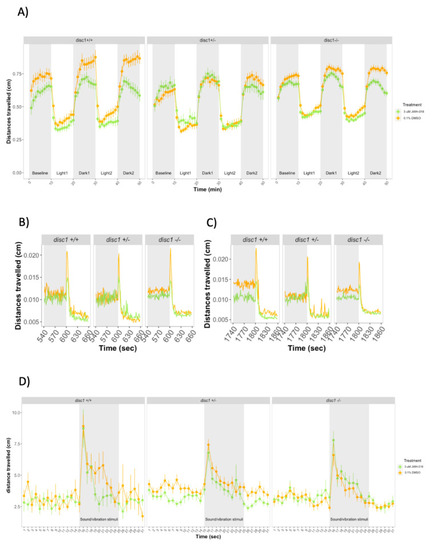
(A) Forced light/dark test in 5 dpf wild-type and disc1 loss-function mutant larvae. Sample sizes for each group: control disc1 +/+: n = 30, JWH-018 disc1 +/+: n = 34, control disc1 +/–: n = 33, JWH-018 disc1 +/–: n = 27, control disc1 –/–: n = 107, JWH-018 disc1 –/–: n = 92. Each dot represents mean distance travelled per minute. Error bars represent ± SEM. (B,C) One-second resolution plots of the transitions from dark to light during the forced light/dark test. Each dot represents mean distance travelled per second. (D) Response and habituation to startle stimuli test in 6 dpf control and JWH-018-treated wild-type and disc1 mutant larvae. Sample sizes: control disc1 +/+: n = 15, JWH-018 disc1 +/+: n = 13, control disc1 +/–: n = 47, JWH-018 disc1 +/–: n = 47, control disc1 –/–: n = 22, JWH-018 disc1 –/–: n = 22. PHENOTYPE:
|
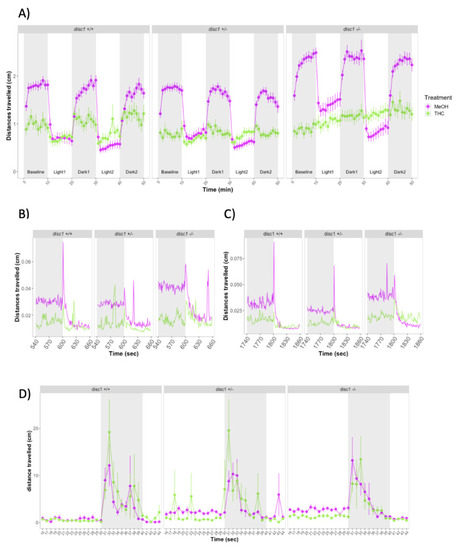
(A) Forced light/dark test in 5 dpf wild-type and disc1 loss-function mutant larvae. Sample sizes for each group: control disc1 +/+: n = 39, THC disc1 +/+: n = 29, control disc1 +/–: n = 41, THC disc1 +/–: n = 45, control disc1 –/–: n = 40, THC disc1 –/–: n = 29. Each dot represents mean distance travelled per minute. Error bars represent ± SEM. (B,C) One-second resolution plots of the transitions from dark to light during the forced light/dark test. Each dot represents mean distance travelled per second. (D) Response and habituation to startle stimuli test in 6 dpf control and THC-treated wild-type and disc1 mutant larvae. Sample sizes: control disc1 +/+: n = 36, THC disc1 +/+: n = 35, control disc1 +/–: n = 36, THC disc1 +/–: n = 35, control disc1 –/–: n = 36, THC disc1 –/–: n = 36. |
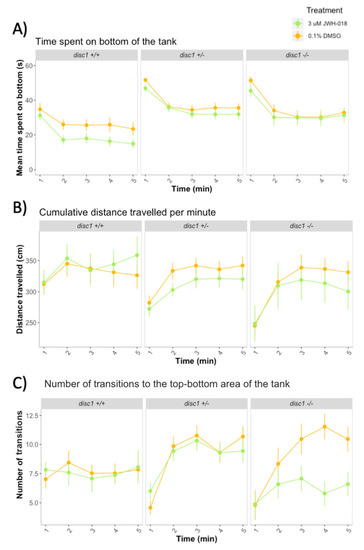
Novel tank diving response in adult wild-type and mutant disc1 zebrafish after developmental exposure to 3 μM JWH-018. (A) Time spent on the bottom of the tank, (B) Cumulative distance travelled (C) Number of transitions between the top and bottom of the tank. Sample sizes for each group: control disc1 +/+: n = 23, JWH-018 disc1 +/+: n = 17, control disc1 +/–: n = 35, JWH-018 disc1 +/–: n = 34, control disc1 –/–: n = 15, JWH-018 disc1 –/–: n = 19. Error bars represent ± SEM. |