|
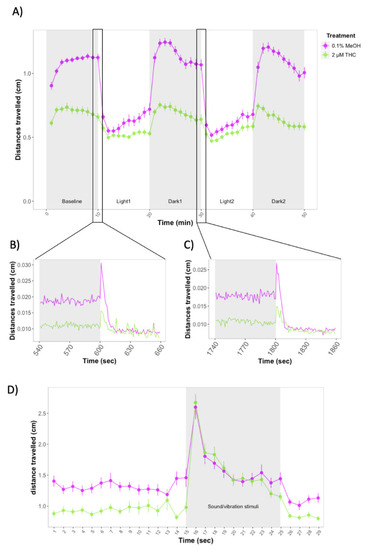
(A) Forced light/dark test in wild-type zebrafish exposed to 2 μM THC. Sample size: n = 48 for each dose group. Each dot represents the mean of the total distance travelled per minute. Error bars represent ± SEM. (B,C) One-second resolution plots of the transitions from dark to light during the forced light/dark test. (D) Distances travelled by control and THC-treated larvae before and after exposure to 10 sound/vibration stimuli. Figure shows mean distances travelled in one-second time bins. Each dot represents mean distance travelled per second.Error bars represent ± SEM. Sample sizes: n = 48 per dose group.
|