
Image
|
Figure Caption
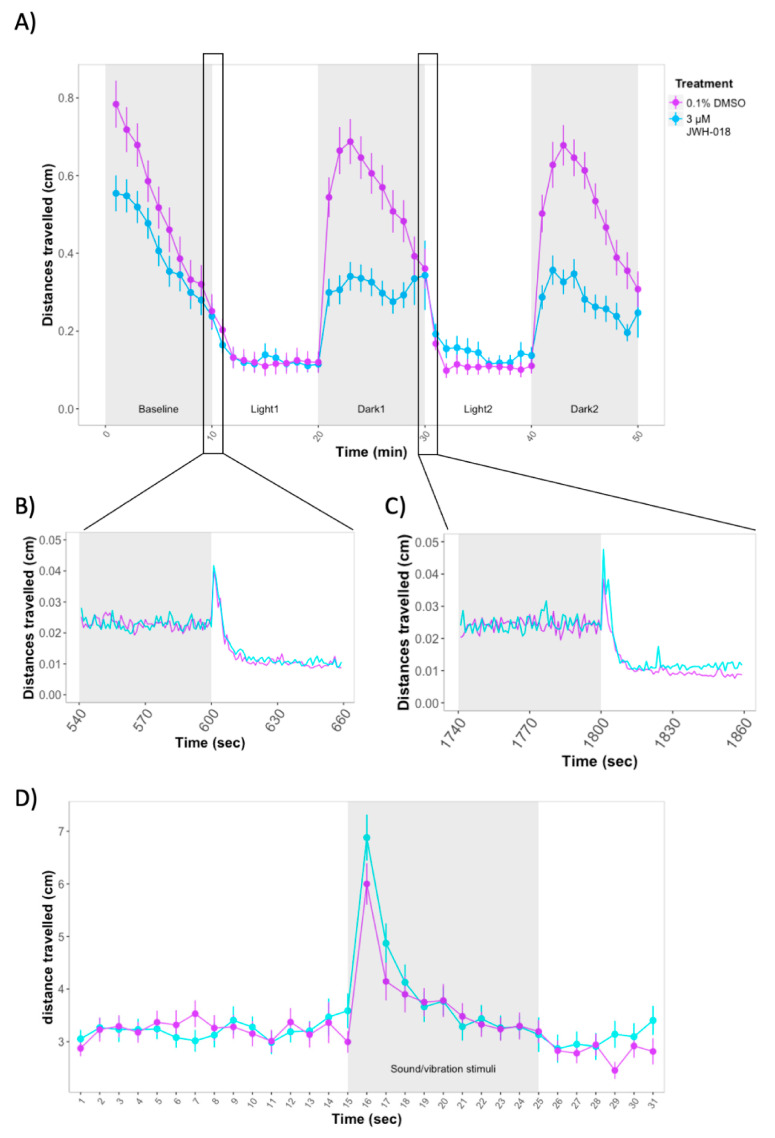
Figure 2 (A) Forced light/dark test in 5 days post fertilization (dpf) zebrafish larvae. Sample size: n = 64 for each dose group. Each dot represents mean distance travelled per minute. Error bars represent ± SEM. (B,C) One-second resolution plots of the transitions from dark to light during the forced light/dark test. (D) Response and habituation to acoustic startle in 6 dpf zebrafish larvae. Sample sizes: control: n = 87, JWH-018-treated: n = 81. Each dot represents mean distance travelled per second. Error bars represent ± SEM.
Figure Data
Acknowledgments
This image is the copyrighted work of the attributed author or publisher, and
ZFIN has permission only to display this image to its users.
Additional permissions should be obtained from the applicable author or publisher of the image.
Full text @ Biomolecules