
|
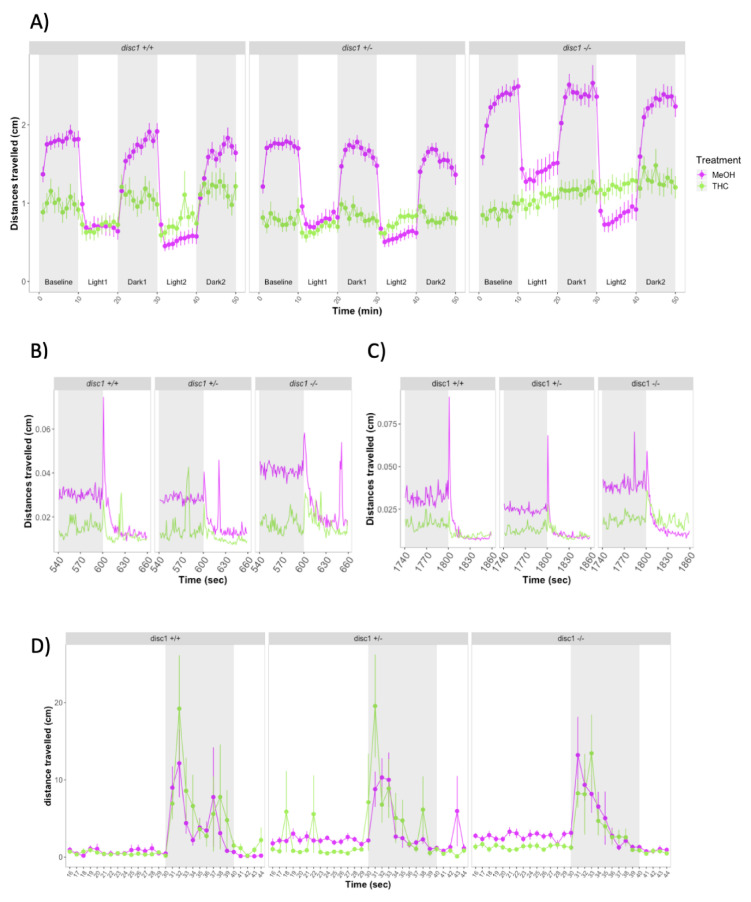
Figure 6 (A) Forced light/dark test in 5 dpf wild-type and disc1 loss-function mutant larvae. Sample sizes for each group: control disc1 +/+: n = 39, THC disc1 +/+: n = 29, control disc1 +/–: n = 41, THC disc1 +/–: n = 45, control disc1 –/–: n = 40, THC disc1 –/–: n = 29. Each dot represents mean distance travelled per minute. Error bars represent ± SEM. (B,C) One-second resolution plots of the transitions from dark to light during the forced light/dark test. Each dot represents mean distance travelled per second. (D) Response and habituation to startle stimuli test in 6 dpf control and THC-treated wild-type and disc1 mutant larvae. Sample sizes: control disc1 +/+: n = 36, THC disc1 +/+: n = 35, control disc1 +/–: n = 36, THC disc1 +/–: n = 35, control disc1 –/–: n = 36, THC disc1 –/–: n = 36.