
- Title
-
Nonthermal and reversible control of neuronal signaling and behavior by midinfrared stimulation
- Authors
- Liu, X., Qiao, Z., Chai, Y., Zhu, Z., Wu, K., Ji, W., Li, D., Xiao, Y., Mao, L., Chang, C., Wen, Q., Song, B., Shu, Y.
- Source
- Full text @ Proc. Natl. Acad. Sci. USA
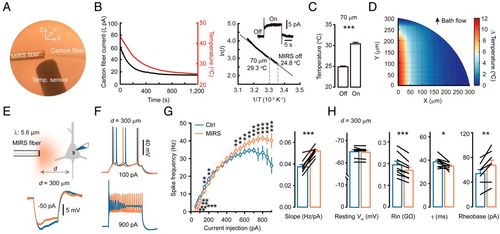
Nonthermal effects of MIRS on neuronal excitability. (A) Configuration for temperature measurement using a carbon fiber (diameter: 7 μm; naked length: 20 μm). The cladding diameter of the MIRS fiber is 170 μm. (B, Left) Change of the measured currents as the bath cools down from ∼45 to 25 °C. (B, Right) Arrhenius plot of the carbon fiber current (I, pA) versus the temperature (T, absolute temperature). (B, Inset) An example current trace of the carbon fiber induced by MIRS at 70 μm away. (C) Measured temperature before and during MIRS. (D) A two-dimensional heatmap of temperature change. Note the direction of the bath flow. (E, Top) Schematic illustration of MIRS and whole-cell recording from a PC in a prefrontal cortex slice. (E, Bottom) Example Vm responses to negative current pulses (500 ms in duration). Blue, control (Ctrl); orange, MIRS. (F) Representative spiking responses to positive current pulses. Note the decrease and increase in AP frequency with small and large current pulses, respectively. (G) Comparison of I–F curves (Left) and slopes (Right) before and during MIRS at 300 μm away from the cell. (H) Group data showing changes in resting Vm, Rin, membrane time constant τ, and rheobase current upon MIRS at 300 μm. *P < 0.05, **P < 0.01, and ***P < 0.001. Paired Student’s t test. Error bars represent SEM. |
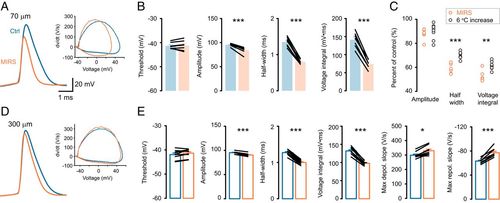
MIRS causes changes in AP waveforms. (A–C) MIRS at 70 μm away from the recorded cell. (D and E) MIRS at 300 μm away. (A) Representative AP waveforms (Left) and their phase plots (Right) before and during MIRS. (B) Comparison of AP parameters before and during MIRS. (C) Comparison of the changes in peak amplitude, half-width, and voltage integral of APs with MIRS and by an increase in temperature (6 °C, gray). (D) Representative AP waveforms and their phase plots before and during MIRS at 300 μm away. (E) Comparison of AP parameters. *P < 0.05, **P < 0.01, and ***P < 0.001. Paired Student’s t test (B and E) and independent Wilcoxon rank-sum test (C). Error bars represent SEM. |
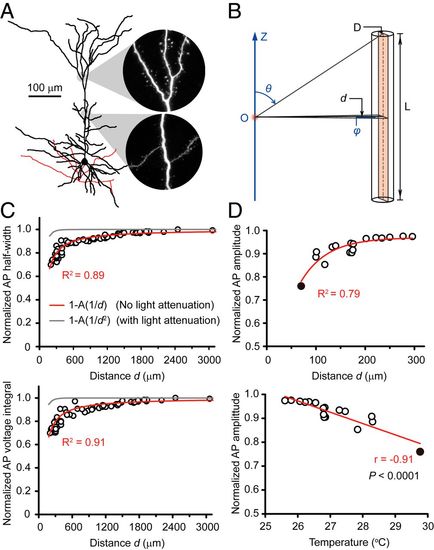
MIRS exerts long-distance nonthermal effects on AP waveforms. (A) A reconstructed layer-5 PC with cylinder-like neurites (total dendritic length: 6,345 μm). (B) A cable model for calculating the MIRS energy received by a neuron. The cylinder denotes the neuron with a length L and a diameter D. The orange rectangle indicates the projected area. The label d indicates the vertical distance of the source to the projected area, while θ, φ, and O denote the applied spherical coordinates and its origin (at the light source), respectively. (C) Plots of AP half-width and voltage integral as a function of the distance d from the MIRS fiber tip. The circles indicate the experimental data (n = 19 cells), as normalized to those in control. The red and gray curves denote the theoretical model (Eqs. 1 and 2 in SI Appendix, Methods) results. The diameter of the soma is typically 10 to 20 μm. We set the adjustable parameter A = 64 μm after fitting experimental data with the red curves and applied this value to generate the gray curves. (D) Plots of the normalized AP peak amplitudes (n = 20 cells) as a function of the distance d and temperature. The filled circles are the average data from seven cells at 70 μm. The red lines represent single exponential fit (Top) and linear regression fit (Bottom). |
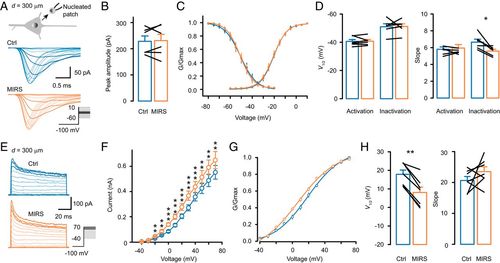
MIRS enhances K+ but not Na+ currents. (A–D) Effects of MIRS (300 μm away from the nucleated patch) on voltage-gated Na+ currents. (E–H) Effects of MIRS on voltage-gated K+ currents. (A) Schematic diagram of a somatic nucleated patch (Top) and representative families of Na+ currents in control (blue) and during MIRS (orange). (A, Inset) Voltage commands. (B) Peak amplitudes of Na+ currents. (C) Activation and steady-state inactivation curves of Na+ currents. (D) Comparison of the half-activation and -inactivation voltages and the corresponding slopes before and during MIRS. (E) Representative families of K+ currents evoked by a series of step voltages (Inset) in control (blue) and during MIRS (orange). (F) I–V curves of K+ currents. (G) Activation curves of the K+ currents. (H) Group data comparing the half-activation voltages and the slopes. *P < 0.05, **P < 0.01, and ***P < 0.001. Paired Student’s t test. Error bars represent SEM. |
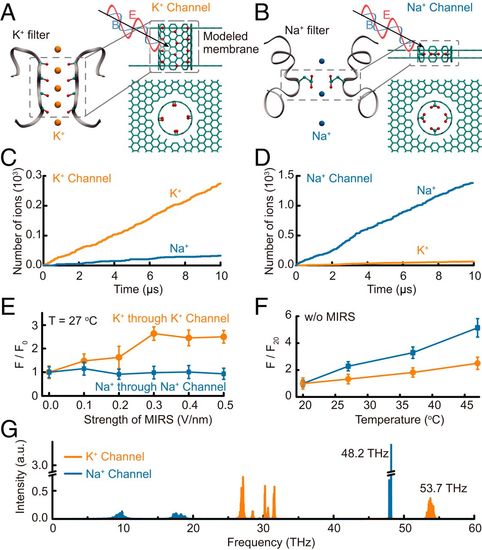
Molecular dynamics simulations reveal distinct modulation of K+ and Na+ channels by MIRS. (A and B) Modeled K+ and Na+ channels. (A and B, Left) Specific peptide structure of the ion selectivity filter (PDB ID codes 1K4C for the K+ filter and 3RVY for the Na+ filter). The red and cyan balls indicate the critically functional atoms oxygen and carbon of the filter on the protein chains (gray ribbons); orange and blue denote individual K+ and Na+, respectively. (A and B, Right) Side (Upper) and top (Lower) views of the modeled filters employed in MD simulations. The cyan tube and two sheets represent the channel and its supporting bilayered membrane, respectively. The red and cyan balls denote oxygen and carbon atoms. The black arrows together with the red and blue curves indicate the added MIRS. (C and D) Selectivity efficiencies of modeled K+ (C) and Na+ (D) channels. A typical process of ion permeation through the channel. (E and F) Effects of MIRS and temperature on ion flow through the channel. The flow is normalized to the one without MIRS (F0; E) or to that at a temperature of 20 °C (F20; F). (G) Vibration spectra of modeled K+ (orange) and Na+ (blue) channels. The peaks at 53.7 and 48.2 THz are contributed by the –C=O and –COO- vibrations, respectively. |
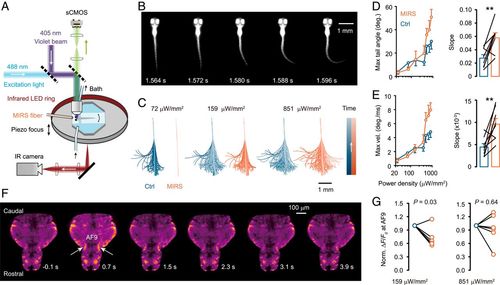
MIRS regulates VLS-induced neural activity and startle responses in larval zebrafish. (A) Schematic drawing of the calcium (sCMOS) and behavior (infrared [IR] camera) imaging system, together with the arrangement of bath perfusion, violet light stimulation, and near-infrared illumination (LED ring). (B) A representative larval zebrafish showing the initial movement of a C-start response induced by VLS (duration: 1 s; onset time: 0 s). (C) Video-captured tail positions (presented in chronological order by gradient color) in single trials with VLS at the given power densities. Note that MIRS inhibits C-start responses to weak VSL but enhances those to high-intensity stimulation. (D and E) VLS intensity-dependent tail movement (D, the maximum tail angle and its slope; E, the maximum angular velocity and its slope) and the regulation by MIRS. (F) Representative single horizontal section showing fish brain Ca2+ signals at the given time points in a trial. (G) Group data showing the effect of MIRS on fluorescence signals (normalized to control) in AF9 during the time window from 0.5 to 0.9 s after the withdrawal of VLS (also see Materials and Methods). The intensities for weak and strong VLS are shown. **P < 0.01. Paired Student’s t test. Error bars represent SEM. |