
Fig. 5
- ID
- ZDB-FIG-210406-14
- Publication
- Liu et al., 2021 - Nonthermal and reversible control of neuronal signaling and behavior by midinfrared stimulation
- Other Figures
- All Figure Page
- Back to All Figure Page
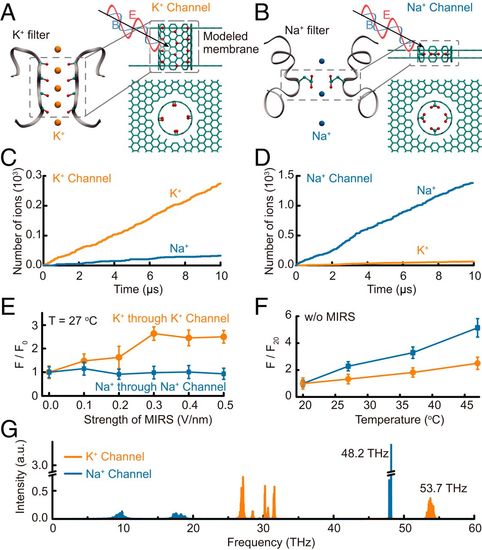
Molecular dynamics simulations reveal distinct modulation of K+ and Na+ channels by MIRS. (A and B) Modeled K+ and Na+ channels. (A and B, Left) Specific peptide structure of the ion selectivity filter (PDB ID codes 1K4C for the K+ filter and 3RVY for the Na+ filter). The red and cyan balls indicate the critically functional atoms oxygen and carbon of the filter on the protein chains (gray ribbons); orange and blue denote individual K+ and Na+, respectively. (A and B, Right) Side (Upper) and top (Lower) views of the modeled filters employed in MD simulations. The cyan tube and two sheets represent the channel and its supporting bilayered membrane, respectively. The red and cyan balls denote oxygen and carbon atoms. The black arrows together with the red and blue curves indicate the added MIRS. (C and D) Selectivity efficiencies of modeled K+ (C) and Na+ (D) channels. A typical process of ion permeation through the channel. (E and F) Effects of MIRS and temperature on ion flow through the channel. The flow is normalized to the one without MIRS (F0; E) or to that at a temperature of 20 °C (F20; F). (G) Vibration spectra of modeled K+ (orange) and Na+ (blue) channels. The peaks at 53.7 and 48.2 THz are contributed by the –C=O and –COO- vibrations, respectively. |