
|
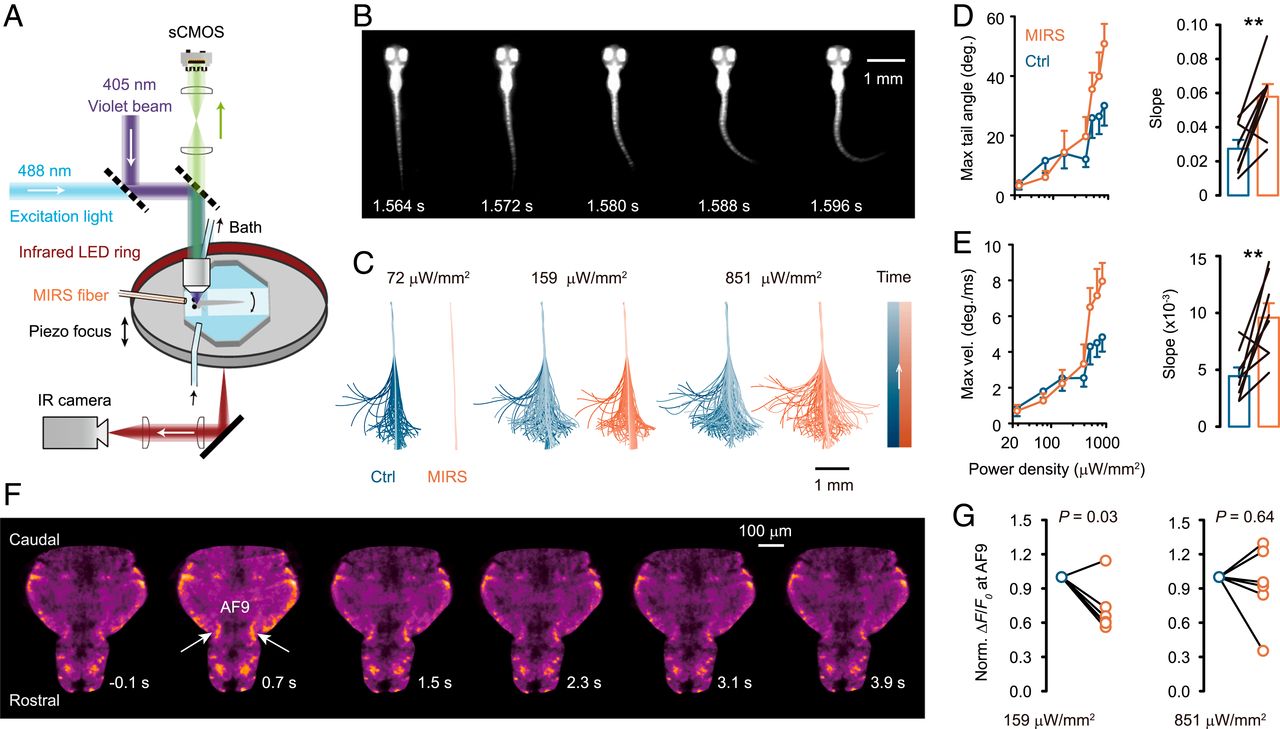
Fig. 6 MIRS regulates VLS-induced neural activity and startle responses in larval zebrafish. (A) Schematic drawing of the calcium (sCMOS) and behavior (infrared [IR] camera) imaging system, together with the arrangement of bath perfusion, violet light stimulation, and near-infrared illumination (LED ring). (B) A representative larval zebrafish showing the initial movement of a C-start response induced by VLS (duration: 1 s; onset time: 0 s). (C) Video-captured tail positions (presented in chronological order by gradient color) in single trials with VLS at the given power densities. Note that MIRS inhibits C-start responses to weak VSL but enhances those to high-intensity stimulation. (D and E) VLS intensity-dependent tail movement (D, the maximum tail angle and its slope; E, the maximum angular velocity and its slope) and the regulation by MIRS. (F) Representative single horizontal section showing fish brain Ca2+ signals at the given time points in a trial. (G) Group data showing the effect of MIRS on fluorescence signals (normalized to control) in AF9 during the time window from 0.5 to 0.9 s after the withdrawal of VLS (also see Materials and Methods). The intensities for weak and strong VLS are shown. **P < 0.01. Paired Student’s t test. Error bars represent SEM.