
Fig. 1
- ID
- ZDB-FIG-210406-10
- Publication
- Liu et al., 2021 - Nonthermal and reversible control of neuronal signaling and behavior by midinfrared stimulation
- Other Figures
- All Figure Page
- Back to All Figure Page
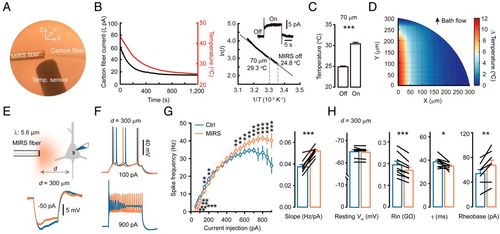
Nonthermal effects of MIRS on neuronal excitability. (A) Configuration for temperature measurement using a carbon fiber (diameter: 7 μm; naked length: 20 μm). The cladding diameter of the MIRS fiber is 170 μm. (B, Left) Change of the measured currents as the bath cools down from ∼45 to 25 °C. (B, Right) Arrhenius plot of the carbon fiber current (I, pA) versus the temperature (T, absolute temperature). (B, Inset) An example current trace of the carbon fiber induced by MIRS at 70 μm away. (C) Measured temperature before and during MIRS. (D) A two-dimensional heatmap of temperature change. Note the direction of the bath flow. (E, Top) Schematic illustration of MIRS and whole-cell recording from a PC in a prefrontal cortex slice. (E, Bottom) Example Vm responses to negative current pulses (500 ms in duration). Blue, control (Ctrl); orange, MIRS. (F) Representative spiking responses to positive current pulses. Note the decrease and increase in AP frequency with small and large current pulses, respectively. (G) Comparison of I–F curves (Left) and slopes (Right) before and during MIRS at 300 μm away from the cell. (H) Group data showing changes in resting Vm, Rin, membrane time constant τ, and rheobase current upon MIRS at 300 μm. *P < 0.05, **P < 0.01, and ***P < 0.001. Paired Student’s t test. Error bars represent SEM. |