
Fig. 2
- ID
- ZDB-FIG-210406-11
- Publication
- Liu et al., 2021 - Nonthermal and reversible control of neuronal signaling and behavior by midinfrared stimulation
- Other Figures
- All Figure Page
- Back to All Figure Page
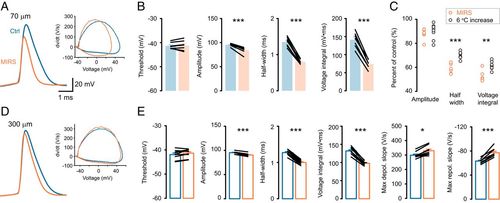
MIRS causes changes in AP waveforms. (A–C) MIRS at 70 μm away from the recorded cell. (D and E) MIRS at 300 μm away. (A) Representative AP waveforms (Left) and their phase plots (Right) before and during MIRS. (B) Comparison of AP parameters before and during MIRS. (C) Comparison of the changes in peak amplitude, half-width, and voltage integral of APs with MIRS and by an increase in temperature (6 °C, gray). (D) Representative AP waveforms and their phase plots before and during MIRS at 300 μm away. (E) Comparison of AP parameters. *P < 0.05, **P < 0.01, and ***P < 0.001. Paired Student’s t test (B and E) and independent Wilcoxon rank-sum test (C). Error bars represent SEM. |