
Fig. 3
- ID
- ZDB-FIG-210406-12
- Publication
- Liu et al., 2021 - Nonthermal and reversible control of neuronal signaling and behavior by midinfrared stimulation
- Other Figures
- All Figure Page
- Back to All Figure Page
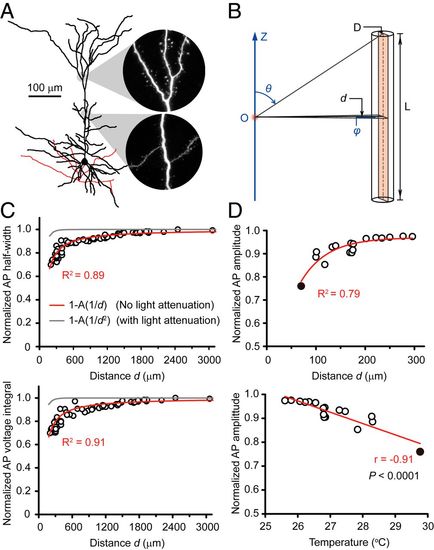
MIRS exerts long-distance nonthermal effects on AP waveforms. (A) A reconstructed layer-5 PC with cylinder-like neurites (total dendritic length: 6,345 μm). (B) A cable model for calculating the MIRS energy received by a neuron. The cylinder denotes the neuron with a length L and a diameter D. The orange rectangle indicates the projected area. The label d indicates the vertical distance of the source to the projected area, while θ, φ, and O denote the applied spherical coordinates and its origin (at the light source), respectively. (C) Plots of AP half-width and voltage integral as a function of the distance d from the MIRS fiber tip. The circles indicate the experimental data (n = 19 cells), as normalized to those in control. The red and gray curves denote the theoretical model (Eqs. 1 and 2 in SI Appendix, Methods) results. The diameter of the soma is typically 10 to 20 μm. We set the adjustable parameter A = 64 μm after fitting experimental data with the red curves and applied this value to generate the gray curves. (D) Plots of the normalized AP peak amplitudes (n = 20 cells) as a function of the distance d and temperature. The filled circles are the average data from seven cells at 70 μm. The red lines represent single exponential fit (Top) and linear regression fit (Bottom). |