
|
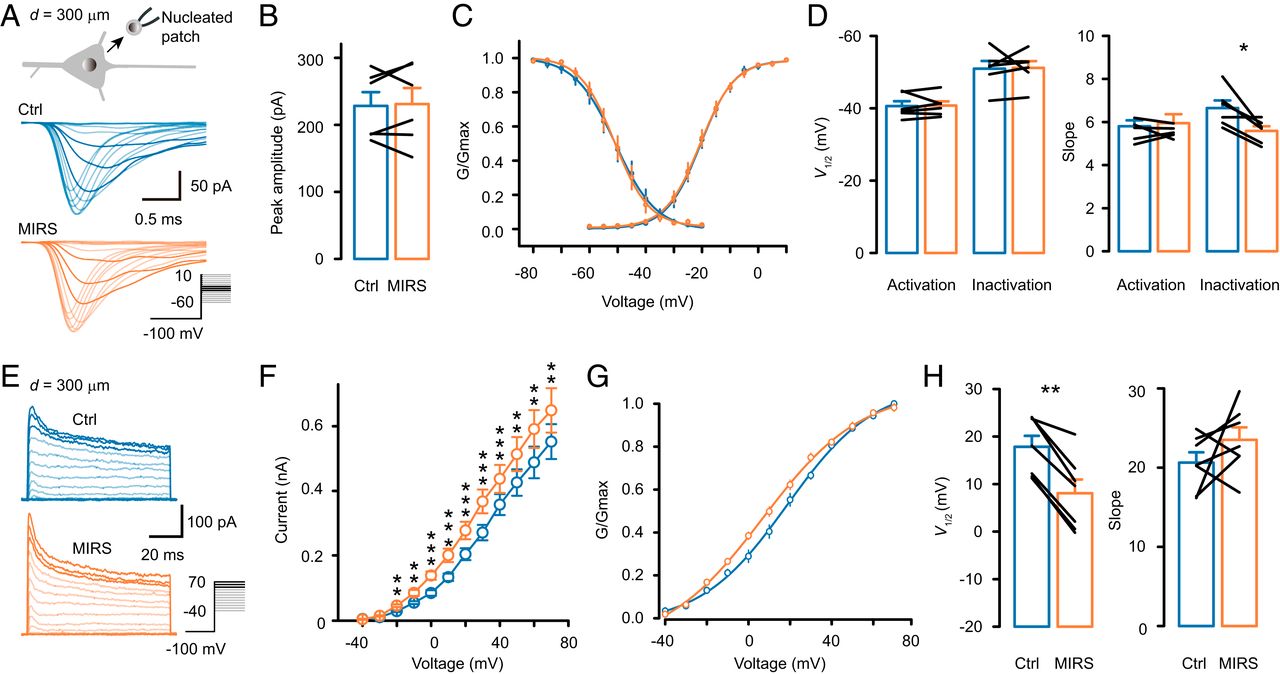
Fig. 4 MIRS enhances K+ but not Na+ currents. (A–D) Effects of MIRS (300 μm away from the nucleated patch) on voltage-gated Na+ currents. (E–H) Effects of MIRS on voltage-gated K+ currents. (A) Schematic diagram of a somatic nucleated patch (Top) and representative families of Na+ currents in control (blue) and during MIRS (orange). (A, Inset) Voltage commands. (B) Peak amplitudes of Na+ currents. (C) Activation and steady-state inactivation curves of Na+ currents. (D) Comparison of the half-activation and -inactivation voltages and the corresponding slopes before and during MIRS. (E) Representative families of K+ currents evoked by a series of step voltages (Inset) in control (blue) and during MIRS (orange). (F) I–V curves of K+ currents. (G) Activation curves of the K+ currents. (H) Group data comparing the half-activation voltages and the slopes. *P < 0.05, **P < 0.01, and ***P < 0.001. Paired Student’s t test. Error bars represent SEM.