
- Title
-
Diphlorethohydroxycarmalol Isolated from Ishige okamurae Exerts Vasodilatory Effects via Calcium Signaling and PI3K/Akt/eNOS Pathway
- Authors
- Lu, Y.A., Jiang, Y., Yang, H.W., Hwang, J., Jeon, Y.J., Ryu, B.
- Source
- Full text @ Int. J. Mol. Sci.
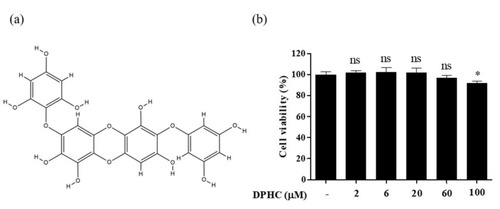
(a) Structure of diphlorethohydroxycarmalol (DPHC) (b) Cell viability analysis of EA.hy926 cells treated with different concentrations of DPHC. EA.hy926 cells were incubated with different concentrations of DPHC (0, 6, 20, 60, and 100 μM) for 24 h, and cell viability was determined by 3-(4-5-dimethyl-2yl)-2-5-diphynyltetrasolium bromide (MTT) assay. Each column and bar represent the mean ± standard deviation (S.D.). * p < 0.05, significant difference compared to the control group. DPHC: diphlorethohydroxycarmalol; ns: not significant. |
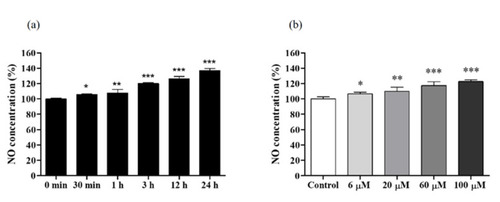
NO production in EA.hy926 cells treated with 60 μM of diphlorethohydroxycarmalol (DPHC). (a) Levels of time-dependent NO production in EA.hy926 cells treated with 60 μM of DPHC. (b) NO production in EA.hy926 cells induced by different concentrations of DPHC. Experiments were performed in triplicates. Each column and bar represent the mean ± standard deviation (S.D.). * p < 0.05, ** p < 0.01. *** p < 0.001, significant difference compared to the control group. |
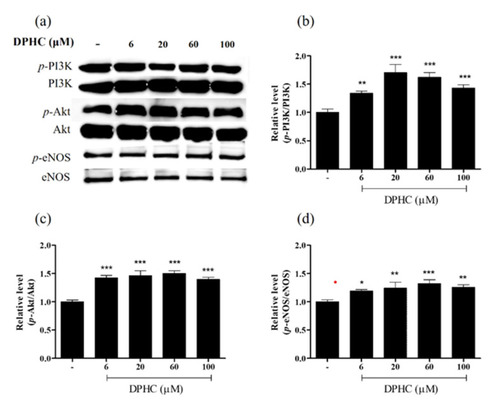
Evaluation of the expression levels of vasodilation-associated proteins. (a) Representative Western blot analysis. (b,c) Quantification of phosphorylated (p)-PI3K/PI3K (b), p-Akt/Akt (c), and p-eNOS/eNOS (d) in EA.hy926 cells treated with different concentrations of DPHC. The protein bands were ultimately developed and photographed with the FUSION Solo Vilber Lourmat system. Quantitative data were analyzed using Image J 1.50i software (NIH, USA). Results are expressed as the mean ± standard deviation (S.D.) of three independent experiments. * p < 0.05, ** p < 0.01. *** p < 0.001, significant difference compared to the control group. DPHC: diphlorethohydroxycarmalol; PI3K: phosphoinositide 3-kinase; Akt: protein kinase B; eNOS: endothelial nitric oxide synthase. |
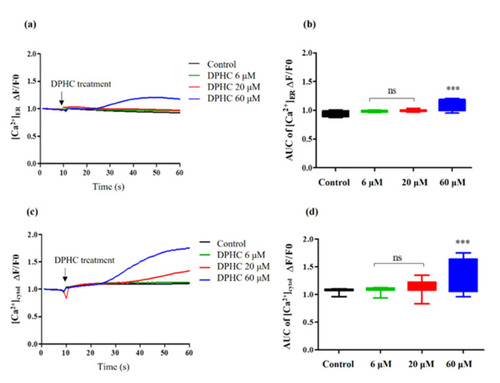
Quantification of the [Ca2+]ER and [Ca2+]cytol levels stimulated by different concentrations of DPHC in EA.hy926 cells. (a,b) The traces (a) and box plots (b) indicating the levels of [Ca2+]ER. (c,d) The traces (c) and box plots (d) indicating the levels of [Ca2+]cytol. For statistical significance, each sample treatment group was compared to the control group. Experiments were performed in triplicates. * p < 0.05, ** p < 0.01, and *** p < 0.001. ns: not significant; AUC: area under the curve; DPHC: diphlorethohydroxycarmalol; [Ca2+]ER: calcium level in the endoplasmic reticulum; [Ca2+]cytol: calcium level in the cytosol; PSS: physiological salt solution. |
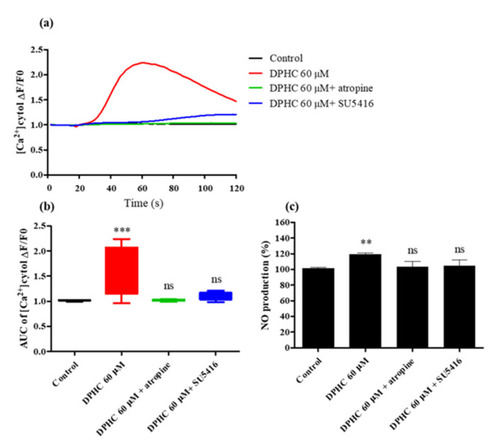
Influence of specific antagonists on [Ca2+]cytol levels in EA.hy926 cells treated with DPHC. ( |
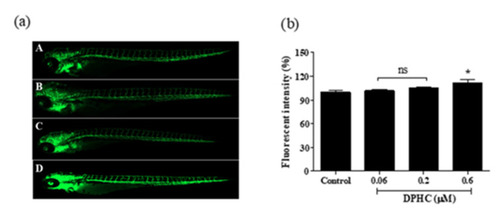
DPHC induces vasodilation in the whole-body vasculature in a Tg(flk:EGFP) transgenic zebrafish model. (a) Representative images of the Tg(flk:EGFP) transgenic zebrafish larva’s whole body captured using a fluorescence microscope (4×). A: 0 μM of DPHC (Control); B: 0.06 μM of DPHC; C: 0.2 μM of DPHC; D: 0.6 μM of DPHC. (b) Quantification of the whole-body fluorescence intensity. Each column and bar represent the mean ± standard deviation (S.D.), n = 8 per group. * p < 0.05, significant difference compared to the control group. ns: not significant; DPHC: diphlorethohydroxycarmalol. |
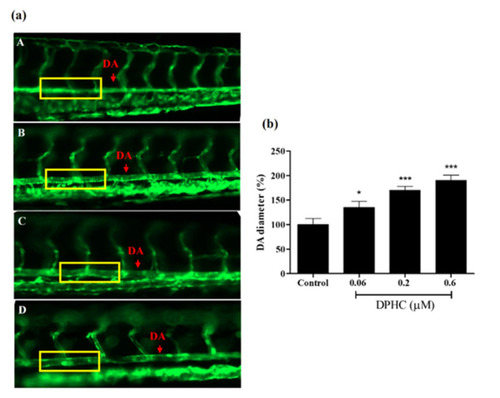
Vasodilation observed by changes in the vessel diameter in a Tg(flk:EGFP) transgenic zebrafish model. (a) Images of the vessel were captured using a fluorescence microscope (20×). (A–D) Vasodilation observed by treatment with DPHC at 6 dpf. A: 0 μM of DPHC (Control); B: 0.06 μM of DPHC; C: 0.2 μM of DPHC; D: 0.6 μM of DPHC. (b) Measurement of the DA diameter. Each column and bar represents the mean ± standard deviation (S.D.), n = 8 per group. * p < 0.05, *** p < 0.001, significant difference compared to the control group. DPHC: diphlorethohydroxycarmalol; DA: dorsal aorta. |