
IMAGE
Figure 2
- ID
- ZDB-IMAGE-210303-30
- Publication
- Lu et al., 2021 - Diphlorethohydroxycarmalol Isolated from Ishige okamurae Exerts Vasodilatory Effects via Calcium Signaling and PI3K/Akt/eNOS Pathway
- All Figures
- Figures for Lu et al., 2021
Image
|
Figure Caption
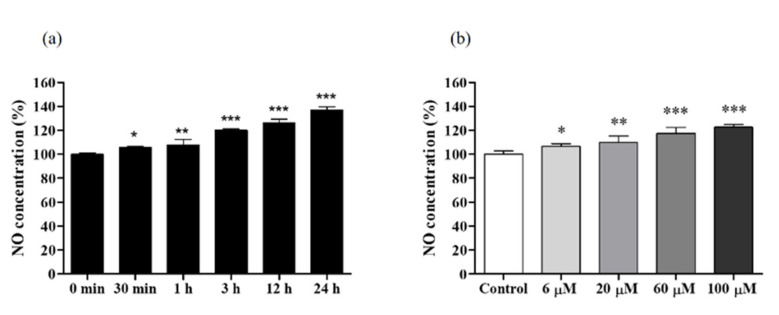
Figure 2 NO production in EA.hy926 cells treated with 60 μM of diphlorethohydroxycarmalol (DPHC). (a) Levels of time-dependent NO production in EA.hy926 cells treated with 60 μM of DPHC. (b) NO production in EA.hy926 cells induced by different concentrations of DPHC. Experiments were performed in triplicates. Each column and bar represent the mean ± standard deviation (S.D.). * p < 0.05, ** p < 0.01. *** p < 0.001, significant difference compared to the control group.
Acknowledgments
This image is the copyrighted work of the attributed author or publisher, and
ZFIN has permission only to display this image to its users.
Additional permissions should be obtained from the applicable author or publisher of the image.
Full text @ Int. J. Mol. Sci.