
Figure 3
- ID
- ZDB-IMAGE-210303-31
- Publication
- Lu et al., 2021 - Diphlorethohydroxycarmalol Isolated from Ishige okamurae Exerts Vasodilatory Effects via Calcium Signaling and PI3K/Akt/eNOS Pathway
- All Figures
- Figures for Lu et al., 2021
|
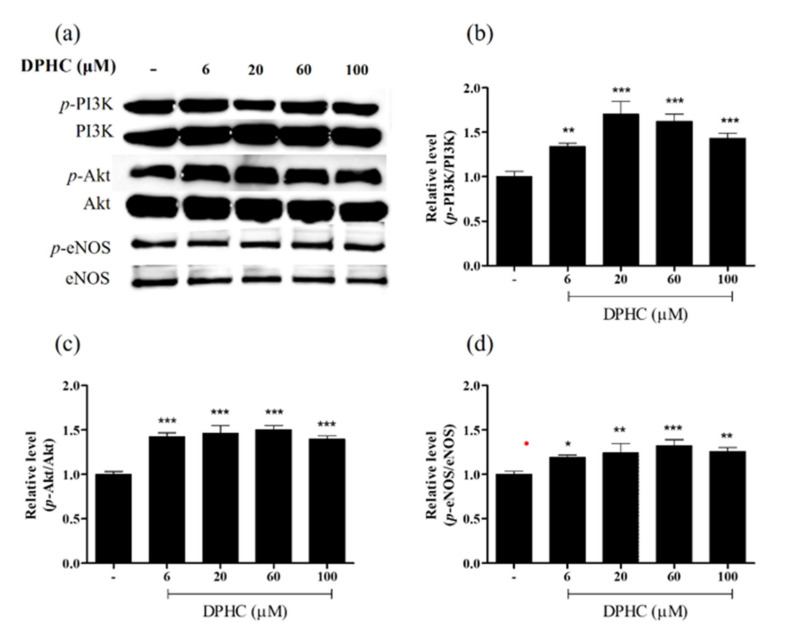
Figure 3 Evaluation of the expression levels of vasodilation-associated proteins. (a) Representative Western blot analysis. (b,c) Quantification of phosphorylated (p)-PI3K/PI3K (b), p-Akt/Akt (c), and p-eNOS/eNOS (d) in EA.hy926 cells treated with different concentrations of DPHC. The protein bands were ultimately developed and photographed with the FUSION Solo Vilber Lourmat system. Quantitative data were analyzed using Image J 1.50i software (NIH, USA). Results are expressed as the mean ± standard deviation (S.D.) of three independent experiments. * p < 0.05, ** p < 0.01. *** p < 0.001, significant difference compared to the control group. DPHC: diphlorethohydroxycarmalol; PI3K: phosphoinositide 3-kinase; Akt: protein kinase B; eNOS: endothelial nitric oxide synthase.