
IMAGE
Figure 6
- ID
- ZDB-IMAGE-210303-34
- Publication
- Lu et al., 2021 - Diphlorethohydroxycarmalol Isolated from Ishige okamurae Exerts Vasodilatory Effects via Calcium Signaling and PI3K/Akt/eNOS Pathway
- All Figures
- Figures for Lu et al., 2021
Image
|
Figure Caption
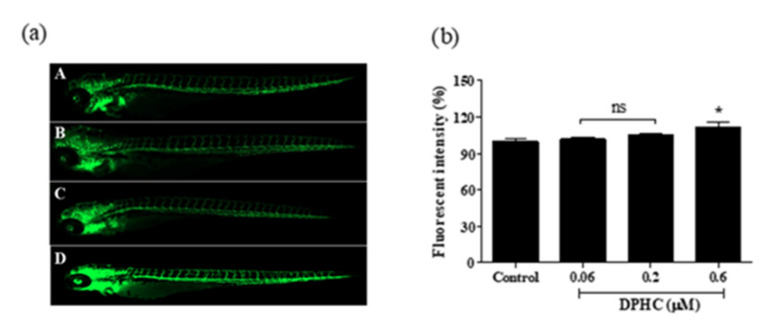
Figure 6 DPHC induces vasodilation in the whole-body vasculature in a Tg(flk:EGFP) transgenic zebrafish model. (a) Representative images of the Tg(flk:EGFP) transgenic zebrafish larva’s whole body captured using a fluorescence microscope (4×). A: 0 μM of DPHC (Control); B: 0.06 μM of DPHC; C: 0.2 μM of DPHC; D: 0.6 μM of DPHC. (b) Quantification of the whole-body fluorescence intensity. Each column and bar represent the mean ± standard deviation (S.D.), n = 8 per group. * p < 0.05, significant difference compared to the control group. ns: not significant; DPHC: diphlorethohydroxycarmalol.
Acknowledgments
This image is the copyrighted work of the attributed author or publisher, and
ZFIN has permission only to display this image to its users.
Additional permissions should be obtained from the applicable author or publisher of the image.
Full text @ Int. J. Mol. Sci.