IMAGE

Figure 5

ID
ZDB-IMAGE-210303-33
Source
Figures for Lu et al., 2021
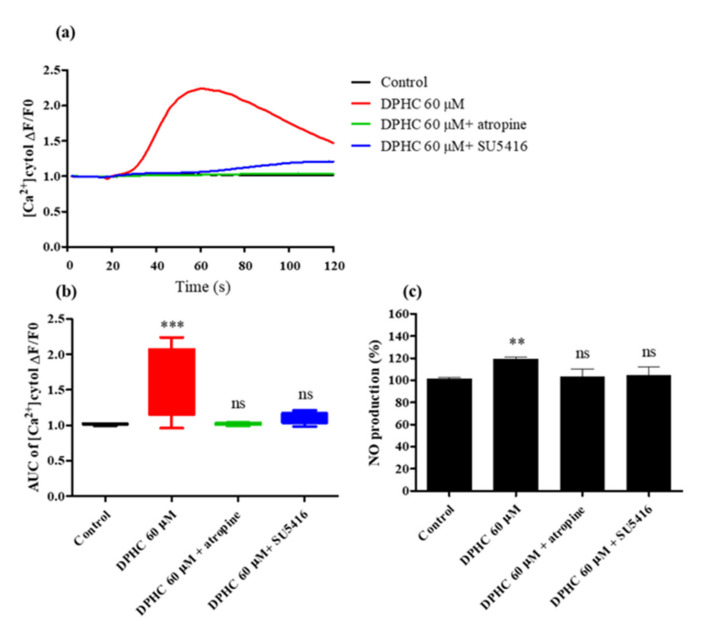
Image
Figure Caption

Figure 5

Influence of specific antagonists on [Ca2+]cytol levels in EA.hy926 cells treated with DPHC. (a,b) Traces (a) and box plots (b) indicating [Ca2+]cytol levels in response to treatment with DPHC (60 μM) and antagonists. (c) Effect of DPHC on NO production in EA.hy926 cells pretreated with atropine or SU5416. The NO levels were detected by adding 10 μM of 4 amino-5-methylamino-2′, 7′-difluorescein diacetate (DAF-FM DA). Experiments were performed in triplicates. Each column and bar represent the mean ± standard deviation (S.D.). ** p < 0.01. *** p < 0.001, significant difference compared to the control group. ns: not significant; AUC: area under the curve; DPHC: diphlorethohydroxycarmalol; [Ca2+]cytol: calcium level in the cytosol.

Acknowledgments
This image is the copyrighted work of the attributed author or publisher, and ZFIN has permission only to display this image to its users. Additional permissions should be obtained from the applicable author or publisher of the image. Full text @ Int. J. Mol. Sci.