Neutrophils and macrophages are found in developing sensory systems. (A) Frontal view of 7-dpf larvae. Bright-field/fluorescent image in whole-mount larvae with OMP:RFP+ OSNs. Lines in red indicate the future adult cribriform plate. (B) Frontal view, whole-mount 7-dpf Tg(mpx:GFP) larva, anti-Sox2–positive taste buds (red, arrowheads), neuromasts (red, asterisks), and neutrophils (green). (C) Lateral view, whole-mount 7 dpf larva. Neutrophils (green) associated with border of the ear (dashed line) (am: ampulla). (D) Neutrophils are highly represented in the olfactory organ (OO) with fewer neutrophils associated with the gustatory and auditory systems. No neutrophils were observed in the retina (n = 30 animals, one-way ANOVA, Tukey test, P < 0.0001). (E) Diagram of head of larva showing generalized position of the cartilages (red) giving rise to the cribriform plate in the adult animal. (F) Frontal view, whole-mount 7-dpf Tg(mpeg1:mCh) larvae, anti-HuC/D–positive neurons in the OO (pale blue), macrophages (red). (G) Lateral view, whole-mount 7 dpf. Macrophages (red) associated with border of the ear (dashed line). (H) The olfactory organ (OO) and the eye have the most macrophages, with fewer macrophages associated with gustatory (mo) and auditory (ear) systems (n = 30 animals, one-way ANOVA, Tukey test, P < 0.001, ns = non-significant). DAPI: blue, mo: mouth, tg: trigeminal ganglia. Scale bars: (B,C,F,G) = 100 μm.

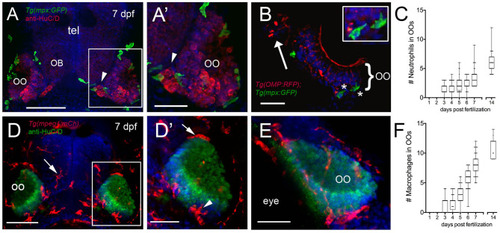
Neutrophils and macrophages populate the olfactory system of juvenile animals. (A) Frontal view of Tg(mpx:GFP) 7dpf larva with anti-HuC/D–positive (red) neurons in the olfactory organ (OO) adjacent to the olfactory bulb (OB). (A) Image of OO (boxed area in A) with neutrophils (green). (B) 25 μm cryosection of a 7-dpf Tg(OMP:RFP);Tg(mpx:GFP) larva neutrophils (green, asterisks) localized within the OO margin and adjacent to OSNs (red, see inset). (C) Average number (±SEM) of neutrophils in OOs of Tg(mpx:GFP) during the first 2 weeks postfertilization (n = 45 larvae). (D) Frontal view of Tg(mpeg1:mCh) 7 dpf larva. Anti-HuC/D–positive (green) neurons populate the olfactory organs (OO). (D) Image of OO (boxed area in D) with macrophages (red) adjacent to the OO (arrow) and within the OO (arrowhead). (E) Lateral oblique view of OO at 7 dpf. (F) Average number (±SEM) of macrophages in OOs of Tg(mpeg1:mCh) during the first 2 weeks post-fertilization (n = 45 larvae). Scale bars: (A,D) = 100 μm; (A,D,E) = 50 μm, (B) = 25 μm.

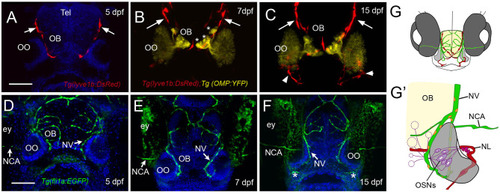
The developing olfactory organs have an extensive blood-lymphatic system. Lyve1b:DsRed+ lymphatic vessels (red) at 5 dpf (A), 7 dpf (B), and 15 dpf (C). (A–C) Lyve1b:DsRed+ lymphatic vasculature (red, arrows) extends from the dorsal brain toward the olfactory organs (OO). (B,C) Lymphatic vessels extend to region of olfactory sensory neurons (OMP:YFP+), yellow, asterisks) in olfactory bulb (OB). (C) At 15 hpf, nasal lymphatic vasculature (red, arrowheads) is now visible wrapping around the posterior OO and associating with the ventral lateral OOs (G). Fli1a:EGFP+ blood vasculature (green) at 5 dpf (D), 7 dpf (E), and 15 dpf (F). Blood vessels (green) forming nasal vein (NV) and nasal ciliary artery (NCA) are present at 5 dpf. The NV extends ventrally (E) encircling the OO (F). (G) Diagram of head of 15 dpf larva showing telencephalon (green) and olfactory organs (gray). (G′) Olfactory organ (gray) summarizing blood (green) and lymphatic (red) vasculature. Nuclei of NV (orange) are positive for both lyve1b:DsRed and fli1a:EGFP. (A,D,E,F): DAPI (blue). OO: olfactory organ, OB: olfactory bulb, ey: eyes. Scale bars: (A–C) = 200 μm, (D–F) = 200 μm.

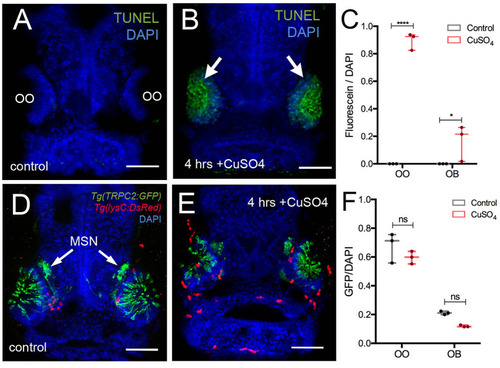
Copper exposure induces cell death and subsequent regeneration in the olfactory sensory system. (A,B) TUNEL assay for copper-induced damage to olfactory organ (OO). Whole mount, 5 dpf larva. (A) Control fish showed no cell death. (B) Only the OOs were positive for TUNEL, green, arrows, DAPI (blue). (C) Quantification of TUNEL fluorescence control and treated animals. (D,E) Frontal view of Tg(trpc2:GFP):Tg(lysC:DsRed) with microvillous sensory neurons (MSN, green) extending into OB in control animals (D) and 4 h posttreatment (E). Neutrophils (red) in the OO, but unlike OSNs, microvillous OSNs were largely unaffected. (F) Quantification of microvillous OSNs (green, fluorescence) in control (gray) and copper-treated animals (red); no significant decrease in Trpc2:GFP fluorescence was observed. All fluorescence was normalized using DAPI (n = 3 larvae, two-way ANOVA, Tukey multiple-comparisons test, ****a = P < 0.0001, b = P < 0.01). All scale bars = 100 μm.

Exposure to copper induces migration of neutrophils. (A-A) Frontal view of Tg(mpx:GFP);Tg(OMP:RFP) larva with OSNs (red) extending into OB. (A) Control. (A) At 4 h post-copper exposure, there was an increase in neutrophils (green) in the OO and OSNs degenerated (red, asterisk). (A) One day post treatment (dp) neutrophils decreased and the OSNs (red) were recovering. (B) Quantification of OSN (red fluorescence) in control (gray), copper-treated animals (red), 1 day (green bar) and 2 days posttreatment (blue bar). All fluorescence was normalized using DAPI (n = 3 larvae, two-way ANOVA, Tukey multiple-comparisons test, ****a = P < 0.0001, b = P < 0.01). All scale bars = 100 μm. (C–C) 5-dpf Tg(mpx: GFP);Tg(OMP:RFP) larva, frontal view. Imaging was initiated at time 0′. At 37′ (C), larvae were exposed to 10 μM of CuSO4, and imaging continued at times indicated (see Supplementary Video 1 for sequence taken every minute). Boxed areas: Neutrophils (green, asterisks) associated with olfactory organ (OO, C–C) and OMP:RFP+ OSNs in olfactory bulb (red, asterisk, C). (C,C) Arrows in (C) non-local neutrophils that do not enter the OO near the ON (see Supplementary Video 4). (D–D) Individual 2D-cell tracking of neutrophils before, during, and after copper exposure. Each color represents a different neutrophil. (E) Number of neutrophils within the OO before and after copper exposure: analysis of six videos from different animals. Unpaired t-test, P < 0.0001). (F) Speed of neutrophils before and after copper exposure (n = 30 neutrophils; Unpaired t-test, P < 0.05). (G) Chemotactic index of neutrophils before and after copper exposure (n = 20 neutrophils; Unpaired t-test, P < 0.05). (H) Time course of neutrophil movement to the OO (n = 48 larvae. ANOVA, Kruskal–Wallis test, P < 0.0001). Scale bar C–C = 150 μm. Tracking was done using the ImageJ plugin, MTrackJ.

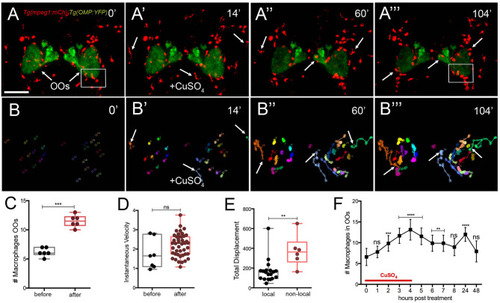
Exposure to copper induces migration response of macrophages in the olfactory organ. (A-A) 5-dpf Tg(mpeg1:mCh);Tg(OMP:YFP) larva frontal view. Imaging was initiated at time 0′. At 14′ (A), larvae were exposed to 10 μM of CuSO4 and imaging continued at times indicated (see Supplementary Video 2 for sequences taken every 2 min). (A, A) Arrows in (A): non-local macrophages that enter the OO (see Supplementary Video 2). (B–B) Individual 2D-cell tracking of macrophages associated with the OOs before, during, and after copper exposure. Each color represents a different macrophage. (C) Number of macrophages within the OO before and after copper exposure: analysis of three independent videos, (Unpaired t-test, P < 0.05). (D) Speed of macrophages before and after copper exposure (n = 50 macrophages, 1 time lapse; Unpaired t-test, P < 0.001). (E) Total displacement of local and non-local macrophages (Supplementary Video 2) during a 2-h time lapse (n = 51 macrophages, 16 local, 35 non-local; unpaired t-test, P < 0.0001). Scale bars: A = 150 μm. Tracking was done using the ImageJ plugin, MTrackJ. (F) Time course of macrophage movement to the OO (n = 24 larvae. ANOVA, Kruskal–Wallis test, P < 0.0001).

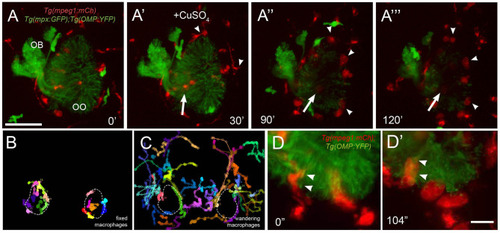
Exposure to copper reveals distinct classes of macrophages. (A-A) 5-dpf Tg(mpeg1:mCh);Tg(mpx:GFP);Tg(OMP:YFP) olfactory organ (OO) and imaging continued at times indicated (see Supplementary Video 3 for sequence taken every minute). (A) Imaging was initiated at time 0′. (A) Larvae were exposed to 10 μM of CuSO4 at 30′. Individual cell tracking reveals the presence of (B) fixed and (C) wandering macrophages. (D) Before copper exposure (from boxed are in A), macrophages (red) are found associated with OSNs (green) in the ventral OO. (D) After exposure to copper (from boxed are in Figure 6A), macrophages (mpeg1:mCh+, red) accumulate at the ventral–basal OO, in close association with degenerating OSNs (green, OMP:YFP+). Arrowheads indicate places where macrophages appeared to engulf degenerating OSNs (mpeg1:mCh+ and OMP:YFP+). Scale bars: A-A = 75 μm, D = 25 μm.

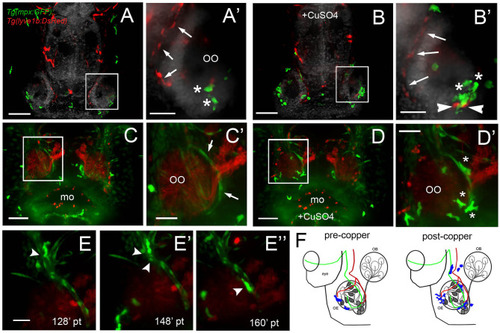
During copper exposure neutrophils migrate in association with blood vasculature to reach to the developing olfactory organ. (A) Frontal view of Tg(mpx:gfp);Tg(lyve1b:DsRed) 7 dpf larva. Boxed area (A) with nasal LV (arrows, red) and neutrophils (green, asterisks). (B) Frontal view of Tg(mpx:GFP);Tg(lyve1b:DsRed) 7 dpf larva after 4 h of copper exposure, neutrophils (green, asterisks) associated with LV in ventral–lateral OO (arrowheads, red). Boxed area (B) indicates cluster of neutrophils (asterisks, green). (C–D) Images from Supplementary Video 4, Tg(fli1a:EGFP);Tg(gata1a:DeRed);Tg(mpx: GFP);Tg(OMP:RFP (quadruple transgenic larva of 5 dpf, showing OSN and erythrocytes in red, and neutrophils and endothelial vasculature in green. (C) Before copper exposure. Boxed area is magnified in (C). Arrows indicate fli1a:EGFP+ branches that enclose the OO (Figure 2G′, NV, green). (D) After exposure to copper, more neutrophils are associated with the OO. (D) Image from boxed area in (D). Asterisks indicate neutrophils that have migrated to the OO on the BV (NV) and clustered around the medial edge of the OO. (E–E) A polarized neutrophil crawling (arrowhead) along the NV to finally enter the OO near the ventral basal ON (E, see Supplementary Video 5). Minutes are posttreatment (pt). (F) Summary: Schematic of nasal blood and lymphatic vasculature at 5 dpf before and after exposure to copper. OO: olfactory organ, OB: olfactory bulb. fli1a:EGFP (green) and lyve1b:DsRed (red), neutrophils (blue) migrate in response to copper exposure using the NV (C-D), entering the OO near ventral ON exiting, and associating with ventral–lateral LV (A-B). Scale bars: (A–D) = 100 μm; (A-D,E–E) = 50 μm.

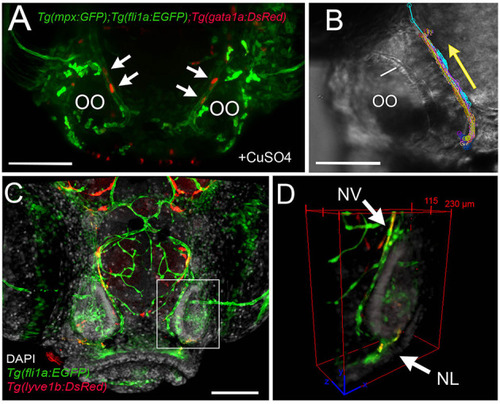
The nasal vein as the primary route to the olfactory organ during development. (A)Tg(fli1a:EGFP);Tg(gata1a:DsRed);Tg(mpx:GFP) larva at 5 dpf. Erythrocytes (gata1:DsRed+, red, arrows) are observed within the nasal vein after copper exposure. (B) Tracking of blood flow of 10 erythrocytes circulating within the NV, whole-mount preparation in transmitted light (video of 2 min). Each color represents a different erythrocyte. Direction of movement is represented as a yellow arrow. (C) Laser confocal maximum projection of a 15-dpf Tg(fli1a:EGFP); Tg(lyve1b:DsRed) larva, DAPI (gray). (D) Three-dimensional orthogonal view generated from optic sections (boxed area in C), showing the NV (nasal vein, arrow) positive for fli1a:EGFP and lyve1b:DsRed. The NL (nasal lymphatics, arrow) is positive for lyve1b:DsRed and passes along the ventrolateral region of the OO. Total depth: 230 μm, 2-μm spacing. Scale bars: (A,C) = 100 μm, (B) = 50 μm.

Summary of neutrophil and macrophage responses to copper-induced damage in the larval olfactory organ (OO). The blood vasculature (BV, green) wraps the olfactory organ (gray) and the lymphatic vasculature (LV, red) extends along the ventral posterior aspect. In untreated animals (before copper), there are local neutrophils (blue) and macrophages (pink) associated with the OO. In response to damage (after copper exposure) of the olfactory sensory neurons (OSNs, dark gray), non-local neutrophils and macrophages migrated to the OO. Neutrophils migrated in association with the BV, and both neutrophils and macrophages were seen associated with the LV. Macrophages changed to a more rounded morphology as they engulfed debris of dying OSNs.

Acknowledgments
This image is the copyrighted work of the attributed author or publisher, and ZFIN has permission only to display this image to its users. Additional permissions should be obtained from the applicable author or publisher of the image. Full text @ Front Cell Dev Biol