FIGURE SUMMARY
Title

Extra-Intestinal Effects of C.difficile Toxin A and B: An In Vivo Study Using the Zebrafish Embryo Model

Authors
Tonon, F., Di Bella, S., Grassi, G., Luzzati, R., Ascenzi, P., di Masi, A., Zennaro, C.
Source
Full text @ Cells

C. difficile toxins affect survival of zebrafish embryos. (a) Kaplan-Meier curve showing zebrafish embryo survival 24 and 48 h after treatment by increasing doses of TcdA (1.5, 2.5, 5 and 10 µg/mL). Data are presented as mean ± SEM. (n = 110 for each group) (p < 0.0001 by log-rank test). (b) Kaplan-Meier curve showing zebrafish embryo survival 24 and 48 h after treatment by increasing doses of TcdB (3, 5, 8 and 10 µg/mL). Data are presented as the mean ± SEM. (n = 110 for each group) (p < 0.0001 by log-rank test).

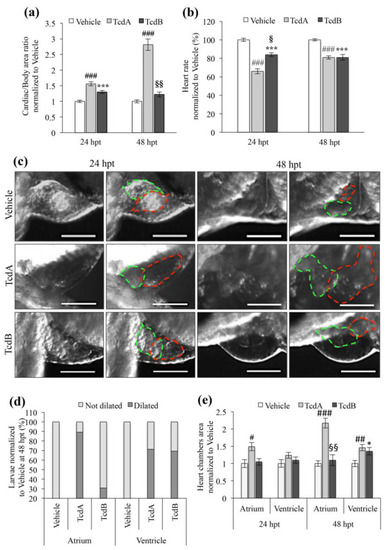
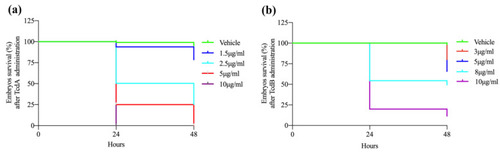
Effects of TcdA and TcdB treatment on zebrafish embryos heart. (a) Evaluation of pericardial edema in zebrafish embryos 24 and 48 h after administration of vehicle, 2.5 µg/mL TcdA or 8 µg/mL TcdB. The histogram displays the ratio of cardiac to total body area. Data are normalized to the vehicle group and are presented as the mean ± SEM. (n = 30 for each group), (###p < 0.001, *** p < 0.001 compared to vehicle; §§p < 0.001 compared to TcdA). (b) Evaluation of the zebrafish embryo heart rate after toxins treatment (2.5 µg/mL TcdA or 8 µg/ mL TcdB). Data are presented as the mean ± SEM. (n = 50), (###p < 0.001, *** p < 0.001 compared to vehicle; §p < 0.01 compared to TcdA). (c) Representative images of the embryos heart chambers after toxins (2.5 µg/mL TcdA or 8 µg/mL TcdB) or vehicle administration. On the left part on the panel, images taken at 24 hpt while on the right part of the panel images taken at 48 hpt. Red dashed lines show atrium while green one marked ventricle. Images were acquired with a Leica S8AP0 stereo microscope. Scale Bar = 200 µm. (d) Effects of 2.5 µg/mL TcdA or 8 µg/mL TcdB administration on the embryos heart chambers at 48 hpt. (n = 20). Data are normalized to vehicle and shown as the mean ± SEM (n = 20 for each group) (e) Quantization of embryos heart chamber area after toxins (2.5 µg/mL TcdA or 8 µg/mL TcdB) or vehicle treatment. Data, normalized to vehicle, are represented as the mean ± SEM. (n = 20 for each group), (#p < 0.05, ##p < 0.01, ###p < 0.001, * p < 0.05 compared to vehicle; §§p < 0.001 compared to TcdA).

Cardiac hypertrophy markers analysis confirms the early role of TcdA in inducing heart damage compared to TcdB in zebrafish embryos. (a) Representative Western blot analysis for Atrial Natriuretic Factor (ANP) in vehicle, 2.5 µg/mL TcdA- or 8 µg/mL TcdB-treated embryos after 24 and 48 h. Actin is used to verify protein loading. (b) Representative Western blot analysis for Brain Natriuretic Peptide (BNP) in vehicle, 2.5 µg/mL TcdA- or 8 µg/mL TcdB-treated embryos at 24 and 48 h. Actin is used to verify protein loading. (c) Densitometric analysis of ANP protein in embryos treated with vehicle, 2.5 µg/mL TcdA or 8 µg/mL TcdB. Data, normalized to β-actin, are expressed as the mean ± SEM. (n = 5), (#p < 0.05, * p < 0.05 compared to vehicle). (d) Densitometric analysis of BNP protein in embryos treated with vehicle, 2.5 µg/mL TcdA or 8 µg/mL TcdB. Data, normalized to β-actin, are expressed as the mean ± SEM. (n = 5), (#p < 0.05, * p < 0.05 compared to vehicle). (e) qRT-PCR analysis of zebrafish NPPA (ANP) and NPPB (BNP) transcripts after 24 and 48 h of 2.5 µg/mL TcdA or 8 µg/mL TcdB treatment. Data, normalized to β-Actin mRNA level, are represented as the mean ± SEM. (n = 9), (###p < 0.001, * p < 0.05 and *** p < 0.001 compared to vehicle; §§p < 0.001 compared to TcdA).

TcdA and TcdB induce different effects on the vascular system of zebrafish embryos. (a) Representative images of zebrafish embryos exposed to vehicle, 2.5 µg/mL TcdA or 8 µg/mL TcdB for 24 or 48 h. Vehicle-, TcdA- and TcdB-treated embryos are shown in the upper, middle and bottom panel, respectively. White asterisks indicate cerebral bleeding whereas black and red arrows show severe vascular damage observed at the tail level. Blue or red arrows indicate moderate or severe pericardial edema, respectively. Images were acquired with a Leica S8 AP0 stereo microscope. Scale bar = 200 µm. (b) The histogram showing the percentage of zebrafish embryos that exhibit bleeding after 2.5 µg/mL TcdA or 8 µg/mL TcdB addition. Data are presented as the mean ± SEM. (n = 6), (#p < 0.05, ##p < 0.01, * p < 0.05 compared to vehicle). (c) The area, length and diameter of the sub-intestinal veins (SIVs) are measured in zebrafish embryos 48 h after 2.5 µg/mL TcdA or 8 µg/mL TcdB administration. A schematic representation of the vessels is reported on the top of the graph and colored in green, red and black to indicate area, length and diameter, respectively. Data, normalized to vehicle, are represented as the mean ± SEM. (n  =  25), (##p < 0.01, ###p < 0.001, compared to vehicle; §p < 0.01 §§p < 0.001 compared to TcdA). (d) Representative images of sub-intestinal veins (SIVs; left panel) and tail vessels (right panel) taken at 24 or 48 h after toxins (2.5 µg/mL TcdA or 8 µg/mL TcdB) or vehicle administration on Tg(fli1:EGFP)Y1 strain embryos. Red arrows show ischemic processes of the sub-intestinal veins SIVs and tail whereas white arrows indicate ectopic processes sprouted from SIVs. Images were acquired with a Leica DM-2000 microscope. Scale bar = 200 µm. (e) qRT-PCR analysis of zebrafish VEGFA2, FLT1 and FLK1 after 2.5 µg/mL TcdA or 8 µg/mL TcdB treatment. Data, normalized to the zebrafish β-Actin mRNA amount, and represented as the mean ± SEM. (n = 9), (###p < 0.001, ##p < 0.01, #p < 0.05, *** p < 0.001 and ** p < 0.01 compared to vehicle; §§p < 0.001 compared to TcdA). (f) qRT-PCR analysis of zebrafish CXCL8 (IL-8) after 2.5 µg/mL TcdA or 8 µg/mL TcdB administration. Data, normalized to the β-Actin mRNA amount, are represented as the mean ± SEM. (n = 9), (###p < 0.001, *** p < 0.001 and ** p < 0.01 compared to vehicle).

C. difficile toxins induce different effects on the morphology of human umbilical vein endothelium cells (HUVEC). (a) Cell viability, evaluated by MTT assay, in HUVEC cells treated with vehicle and increasing doses of TcdA. Data, normalized to vehicle, are represented as the mean ± SEM. (n = 6), (###p < 0.001 compared to vehicle. (b) Cell viability, evaluated by MTT assay, in HUVEC cells treated with vehicle and increasing doses of TcdB. Data, normalized to vehicle, are represented as the mean ± SEM. (n = 6), (*** p < 0.001, ** p < 0.01 compared to vehicle. (c) Analysis of lactate dehydrogenase LDH activity on the supernatant of TcdA-treated HUVEC cells. Data, normalized to Triton X-100-treated cells, are represented as the mean ± SEM (n = 6), (###p < 0.001 compared to vehicle). (d) Analysis of lactate dehydrogenase (LDH) activity on the supernatant of TcdB-treated HUVEC cells. Data, normalized to Triton X-100-treated cells, are represented as the mean ± SEM (n = 6), (*** p < 0.001 compared to vehicle). (e) Representative images of HUVEC treated with vehicle, 2.5 μg/mL TcdA or 8 μg/mL TcdB for 24 h. Images of cellular morphology are taken in bright field (left) Scale bar = 50 µm. In the middle of the panel, images in red and green represent the F-actin and the β-tubulin staining, respectively. On the right, the merge of the red and green fields with DAPI (blue) was shown. Images were acquired with a Leica DM-2000 microscope. Scale Bar = 50 µm. (f) HUVEC cells rounding, expressed as the ratio of total to nuclear area, 24 h after addition of vehicle, 2.5 μg/mL TcdA and 8 μg/mL TcdB. Data are represented as the mean ± SEM (n = 20), (###p < 0.001 compared to vehicle, §§p < 0.01 compared to 2.5 μg/mL TcdA).

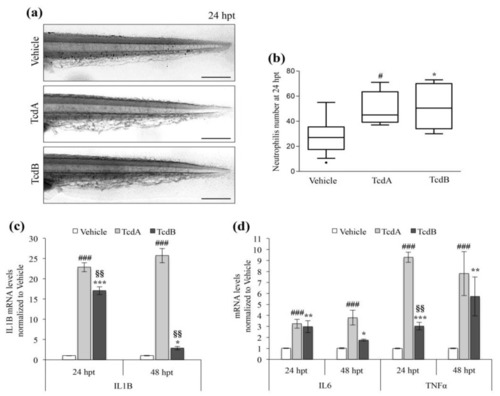
TcdA and TcdB promote the inflammatory response and active the immune system. (a) Representative images of Sudan Black staining of neutrophils at 24 hpt in zebrafish embryos treated with vehicle, 2.5 µg/mL TcdA or 8 µg/mL TcdB. The pictures are lateral view of the tail. Images were acquired with a Leica S8AP0 stereo microscope. Scale bar = 200 µm. (b) Neutrophils number in embryos treated with toxins (2.5 µg/mL TcdA or 8 µg/mL TcdB) or vehicle. Data are represented in a Tukey box and whisker plot, (n = 20), (#p < 0.05, * p < 0.05 compared to vehicle). (c) qRT-PCR analysis of zebrafish pro-inflammatory cytokine IL1B at 24 and 48 h after the administration of 2.5 µg/mL TcdA or 8 µg/mL TcdB. Data, normalized to the β-Actin mRNA amount, are represented as the mean ± SEM. (n = 9), (###p < 0.001, *** p < 0.001 and * p < 0.05 compared to vehicle; §§p < 0.001 compared to TcdA). (d) qRT-PCR analysis of zebrafish pro-inflammatory cytokines IL6 and TNFα at 24 and 48 h after the administration of 2.5 µg/mL TcdA or 8 µg/mL TcdB. Data, normalized to the β-Actin mRNA amount, are represented as the mean ± SEM (n = 9), (###p < 0.001, *** p < 0.001, ** p < 0.01, * p < 0.05 compared to vehicle; §§p < 0.001 compared to TcdA).

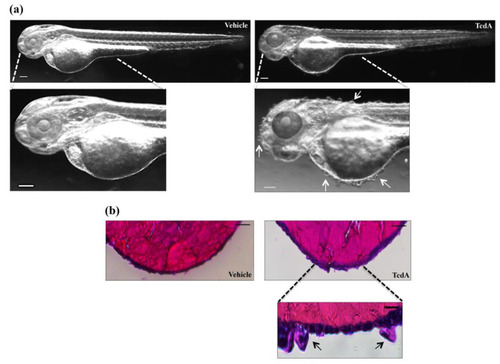
TcdA administration induced skin alteration in zebrafish embryos. (a) Representative images of 2.5 µg/mL TcdA- or vehicle-treated embryos. Images were acquired with a Leica S8AP0 stereo microscope. Scale bar = 100 µm. (b) Hematoxylin and eosin staining is performed on 2.5 µg/mL TcdA- or vehicle-treated embryos to evaluate skin structure. Scale bar = 100 µm (upper panel). A magnification of the hypertrophic cell of the epidemical layer is taken from TcdA-treated embryo (lower panel; scale bar = 10 µm). Images were acquired with a Leica S8AP0 stereo microscope.

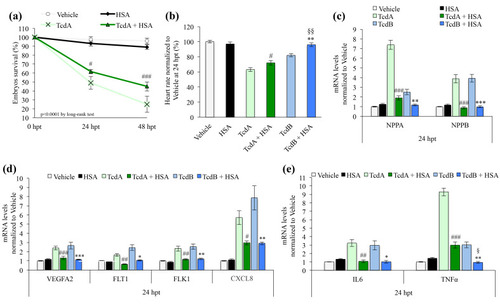
Human serum albumin (HSA) protects zebrafish embryos towards C. difficile toxins intoxication. (a) Kaplan-Meier curve showing zebrafish embryo survival 24 and 48 h after treatment with vehicle, 50 ng HSA, 2.5 µg/mL TcdA or TcdA+HSA. Data are presented as the mean ± SEM. (n = 110 for each group) (p < 0.0001 by log-rank test; #p < 0.05 TcdA compared to TcdA+HSA at 24 hpt; ###p < 0.001 TcdA compared to TcdA+HSA at 48 ht). (b) Evaluation of the zebrafish embryo heart rate after treatment with vehicle or toxins (2.5 µg/mL TcdA or 8 µg/mL TcdB) and/or HSA. Data are presented as the mean ± SEM. (n = 40) (#p < 0.05 compared to TcdA, ** p < 0.01 compared to TcdB; §§p < 0.001 compared to TcdA+HSA). (c) qRT-PCR analysis of zebrafish NPPA and NPPB after 24 h of 2.5 µg/mL TcdA+HSA or 8 µg/mL TcdB-+HSA co-treatments. Data, normalized to the zebrafish β-Actin mRNA level, are compared to vehicle and represented as the mean ± SEM (n = 9) (###p < 0.001 compared to TcdA, ** p < 0.01 and *** p < 0.001 compared to TcdB). (d) qRT-PCR analysis of zebrafish VEGFA2, FLT1, FLK1 and CXCL8 (IL-8) after 24 h of co-treatment with either 2.5 µg/mL TcdA+HSA or 8 µg/mL TcdB+HSA. Data, normalized to the zebrafish β-Actin mRNA amount, are compared to the vehicle and represented as the mean ± SEM (n = 9) (#p < 0.05, ##p < 0.01 and ###p < 0.001 compared to TcdA; * p < 0.05, ** p < 0.01 and *** p < 0.001 compared to TcdB). (e) qRT-PCR analysis of zebrafish IL6 and TNFα after 24 h of co-treatment with either 2.5 µg/mL TcdA+HSA or 8 µg/mL TcdB+HSA. Data, normalized to the β-Actin mRNA level, are compared to vehicle and represented as the mean ± SEM (n = 9) (###p < 0.001 and ##p < 0.01 compared to TcdA; ** p < 0.01 and * p < 0.05 compared to TcdB; §p < 0.01 compared to TcdA+HSA).

Acknowledgments
This image is the copyrighted work of the attributed author or publisher, and ZFIN has permission only to display this image to its users. Additional permissions should be obtained from the applicable author or publisher of the image. Full text @ Cells