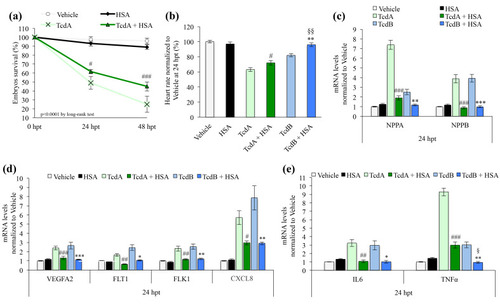
Human serum albumin (HSA) protects zebrafish embryos towards C. difficile toxins intoxication. (a) Kaplan-Meier curve showing zebrafish embryo survival 24 and 48 h after treatment with vehicle, 50 ng HSA, 2.5 µg/mL TcdA or TcdA+HSA. Data are presented as the mean ± SEM. (n = 110 for each group) (p < 0.0001 by log-rank test; #p < 0.05 TcdA compared to TcdA+HSA at 24 hpt; ###p < 0.001 TcdA compared to TcdA+HSA at 48 ht). (b) Evaluation of the zebrafish embryo heart rate after treatment with vehicle or toxins (2.5 µg/mL TcdA or 8 µg/mL TcdB) and/or HSA. Data are presented as the mean ± SEM. (n = 40) (#p < 0.05 compared to TcdA, ** p < 0.01 compared to TcdB; §§p < 0.001 compared to TcdA+HSA). (c) qRT-PCR analysis of zebrafish NPPA and NPPB after 24 h of 2.5 µg/mL TcdA+HSA or 8 µg/mL TcdB-+HSA co-treatments. Data, normalized to the zebrafish β-Actin mRNA level, are compared to vehicle and represented as the mean ± SEM (n = 9) (###p < 0.001 compared to TcdA, ** p < 0.01 and *** p < 0.001 compared to TcdB). (d) qRT-PCR analysis of zebrafish VEGFA2, FLT1, FLK1 and CXCL8 (IL-8) after 24 h of co-treatment with either 2.5 µg/mL TcdA+HSA or 8 µg/mL TcdB+HSA. Data, normalized to the zebrafish β-Actin mRNA amount, are compared to the vehicle and represented as the mean ± SEM (n = 9) (#p < 0.05, ##p < 0.01 and ###p < 0.001 compared to TcdA; * p < 0.05, ** p < 0.01 and *** p < 0.001 compared to TcdB). (e) qRT-PCR analysis of zebrafish IL6 and TNFα after 24 h of co-treatment with either 2.5 µg/mL TcdA+HSA or 8 µg/mL TcdB+HSA. Data, normalized to the β-Actin mRNA level, are compared to vehicle and represented as the mean ± SEM (n = 9) (###p < 0.001 and ##p < 0.01 compared to TcdA; ** p < 0.01 and * p < 0.05 compared to TcdB; §p < 0.01 compared to TcdA+HSA).
|
