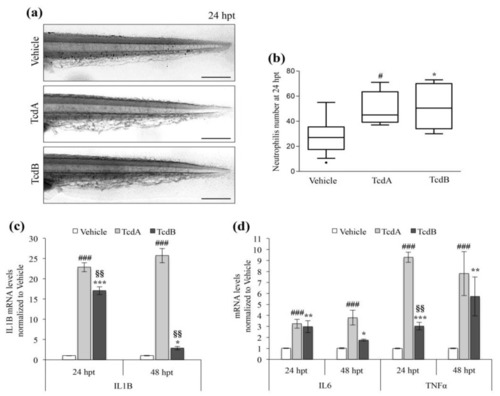
TcdA and TcdB promote the inflammatory response and active the immune system. (a) Representative images of Sudan Black staining of neutrophils at 24 hpt in zebrafish embryos treated with vehicle, 2.5 µg/mL TcdA or 8 µg/mL TcdB. The pictures are lateral view of the tail. Images were acquired with a Leica S8AP0 stereo microscope. Scale bar = 200 µm. (b) Neutrophils number in embryos treated with toxins (2.5 µg/mL TcdA or 8 µg/mL TcdB) or vehicle. Data are represented in a Tukey box and whisker plot, (n = 20), (#p < 0.05, * p < 0.05 compared to vehicle). (c) qRT-PCR analysis of zebrafish pro-inflammatory cytokine IL1B at 24 and 48 h after the administration of 2.5 µg/mL TcdA or 8 µg/mL TcdB. Data, normalized to the β-Actin mRNA amount, are represented as the mean ± SEM. (n = 9), (###p < 0.001, *** p < 0.001 and * p < 0.05 compared to vehicle; §§p < 0.001 compared to TcdA). (d) qRT-PCR analysis of zebrafish pro-inflammatory cytokines IL6 and TNFα at 24 and 48 h after the administration of 2.5 µg/mL TcdA or 8 µg/mL TcdB. Data, normalized to the β-Actin mRNA amount, are represented as the mean ± SEM (n = 9), (###p < 0.001, *** p < 0.001, ** p < 0.01, * p < 0.05 compared to vehicle; §§p < 0.001 compared to TcdA).
|
