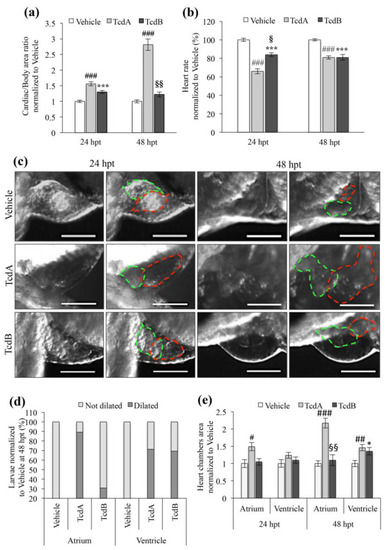
Effects of TcdA and TcdB treatment on zebrafish embryos heart. (a) Evaluation of pericardial edema in zebrafish embryos 24 and 48 h after administration of vehicle, 2.5 µg/mL TcdA or 8 µg/mL TcdB. The histogram displays the ratio of cardiac to total body area. Data are normalized to the vehicle group and are presented as the mean ± SEM. (n = 30 for each group), (###p < 0.001, *** p < 0.001 compared to vehicle; §§p < 0.001 compared to TcdA). (b) Evaluation of the zebrafish embryo heart rate after toxins treatment (2.5 µg/mL TcdA or 8 µg/ mL TcdB). Data are presented as the mean ± SEM. (n = 50), (###p < 0.001, *** p < 0.001 compared to vehicle; §p < 0.01 compared to TcdA). (c) Representative images of the embryos heart chambers after toxins (2.5 µg/mL TcdA or 8 µg/mL TcdB) or vehicle administration. On the left part on the panel, images taken at 24 hpt while on the right part of the panel images taken at 48 hpt. Red dashed lines show atrium while green one marked ventricle. Images were acquired with a Leica S8AP0 stereo microscope. Scale Bar = 200 µm. (d) Effects of 2.5 µg/mL TcdA or 8 µg/mL TcdB administration on the embryos heart chambers at 48 hpt. (n = 20). Data are normalized to vehicle and shown as the mean ± SEM (n = 20 for each group) (e) Quantization of embryos heart chamber area after toxins (2.5 µg/mL TcdA or 8 µg/mL TcdB) or vehicle treatment. Data, normalized to vehicle, are represented as the mean ± SEM. (n = 20 for each group), (#p < 0.05, ##p < 0.01, ###p < 0.001, * p < 0.05 compared to vehicle; §§p < 0.001 compared to TcdA).
|
