IMAGE

Figure 3

ID
ZDB-IMAGE-201229-15
Source
Figures for Tonon et al., 2020
Image
Figure Caption

Figure 3

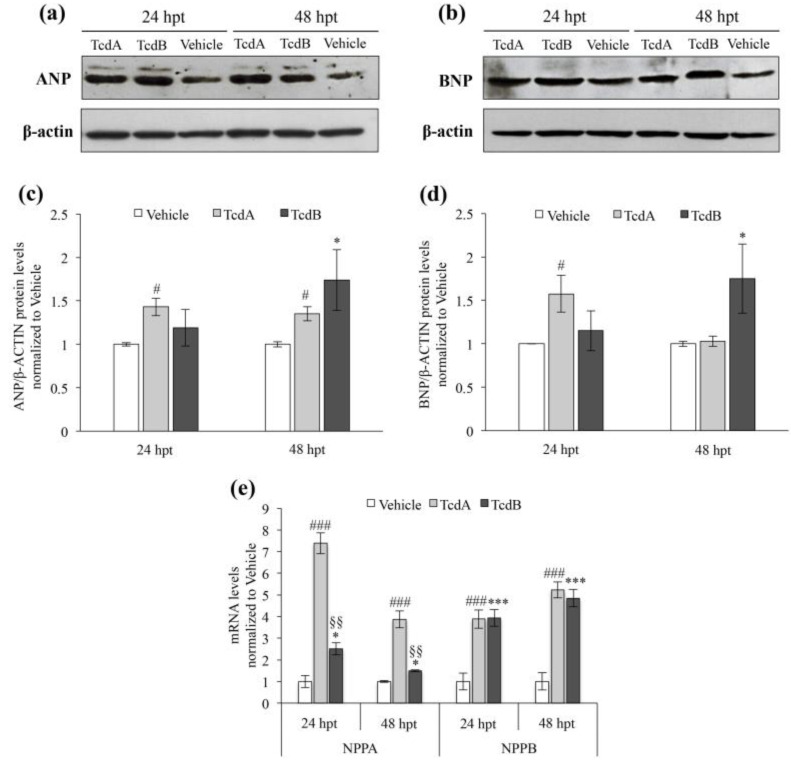
Cardiac hypertrophy markers analysis confirms the early role of TcdA in inducing heart damage compared to TcdB in zebrafish embryos. (a) Representative Western blot analysis for Atrial Natriuretic Factor (ANP) in vehicle, 2.5 µg/mL TcdA- or 8 µg/mL TcdB-treated embryos after 24 and 48 h. Actin is used to verify protein loading. (b) Representative Western blot analysis for Brain Natriuretic Peptide (BNP) in vehicle, 2.5 µg/mL TcdA- or 8 µg/mL TcdB-treated embryos at 24 and 48 h. Actin is used to verify protein loading. (c) Densitometric analysis of ANP protein in embryos treated with vehicle, 2.5 µg/mL TcdA or 8 µg/mL TcdB. Data, normalized to β-actin, are expressed as the mean ± SEM. (n = 5), (#p < 0.05, * p < 0.05 compared to vehicle). (d) Densitometric analysis of BNP protein in embryos treated with vehicle, 2.5 µg/mL TcdA or 8 µg/mL TcdB. Data, normalized to β-actin, are expressed as the mean ± SEM. (n = 5), (#p < 0.05, * p < 0.05 compared to vehicle). (e) qRT-PCR analysis of zebrafish NPPA (ANP) and NPPB (BNP) transcripts after 24 and 48 h of 2.5 µg/mL TcdA or 8 µg/mL TcdB treatment. Data, normalized to β-Actin mRNA level, are represented as the mean ± SEM. (n = 9), (###p < 0.001, * p < 0.05 and *** p < 0.001 compared to vehicle; §§p < 0.001 compared to TcdA).

Acknowledgments
This image is the copyrighted work of the attributed author or publisher, and ZFIN has permission only to display this image to its users. Additional permissions should be obtained from the applicable author or publisher of the image. Full text @ Cells