IMAGE

Figure 4

ID
ZDB-IMAGE-201229-16
Source
Figures for Tonon et al., 2020
Image
Figure Caption

Figure 4

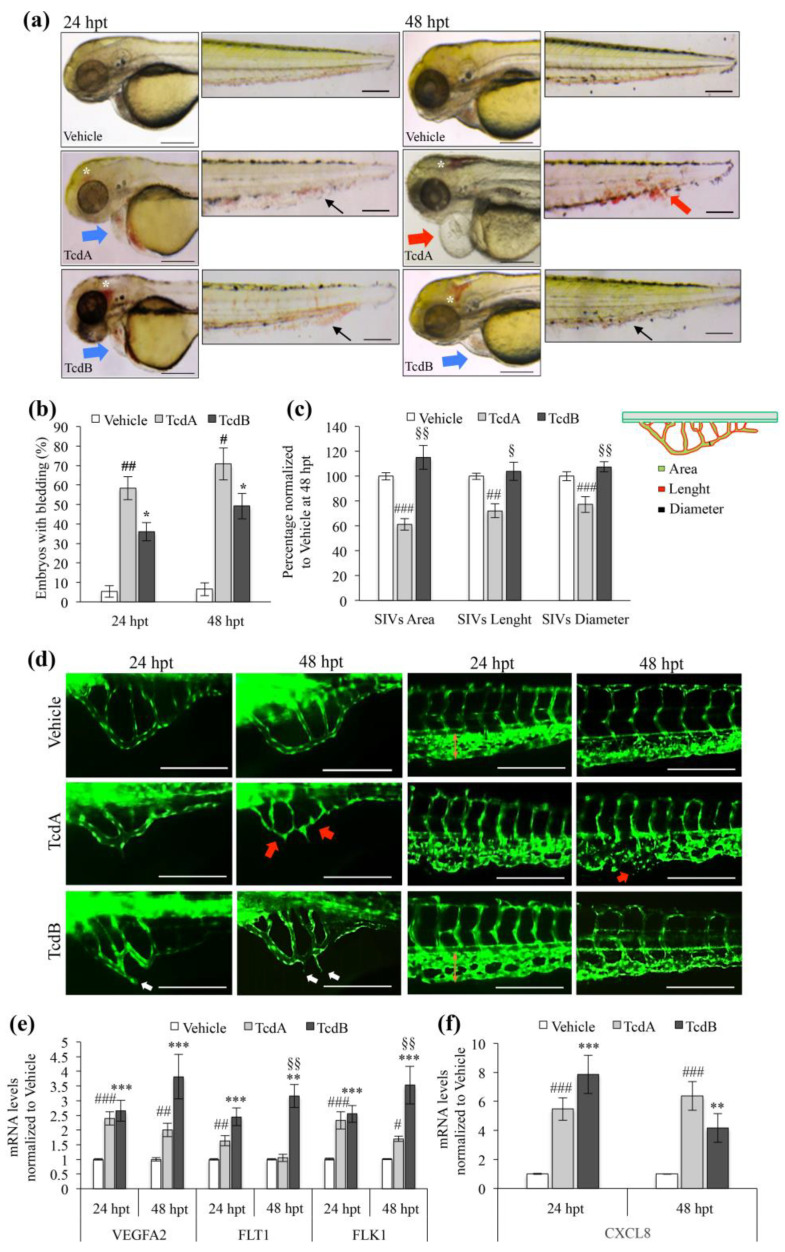
TcdA and TcdB induce different effects on the vascular system of zebrafish embryos. (a) Representative images of zebrafish embryos exposed to vehicle, 2.5 µg/mL TcdA or 8 µg/mL TcdB for 24 or 48 h. Vehicle-, TcdA- and TcdB-treated embryos are shown in the upper, middle and bottom panel, respectively. White asterisks indicate cerebral bleeding whereas black and red arrows show severe vascular damage observed at the tail level. Blue or red arrows indicate moderate or severe pericardial edema, respectively. Images were acquired with a Leica S8 AP0 stereo microscope. Scale bar = 200 µm. (b) The histogram showing the percentage of zebrafish embryos that exhibit bleeding after 2.5 µg/mL TcdA or 8 µg/mL TcdB addition. Data are presented as the mean ± SEM. (n = 6), (#p < 0.05, ##p < 0.01, * p < 0.05 compared to vehicle). (c) The area, length and diameter of the sub-intestinal veins (SIVs) are measured in zebrafish embryos 48 h after 2.5 µg/mL TcdA or 8 µg/mL TcdB administration. A schematic representation of the vessels is reported on the top of the graph and colored in green, red and black to indicate area, length and diameter, respectively. Data, normalized to vehicle, are represented as the mean ± SEM. (n  =  25), (##p < 0.01, ###p < 0.001, compared to vehicle; §p < 0.01 §§p < 0.001 compared to TcdA). (d) Representative images of sub-intestinal veins (SIVs; left panel) and tail vessels (right panel) taken at 24 or 48 h after toxins (2.5 µg/mL TcdA or 8 µg/mL TcdB) or vehicle administration on Tg(fli1:EGFP)Y1 strain embryos. Red arrows show ischemic processes of the sub-intestinal veins SIVs and tail whereas white arrows indicate ectopic processes sprouted from SIVs. Images were acquired with a Leica DM-2000 microscope. Scale bar = 200 µm. (e) qRT-PCR analysis of zebrafish VEGFA2, FLT1 and FLK1 after 2.5 µg/mL TcdA or 8 µg/mL TcdB treatment. Data, normalized to the zebrafish β-Actin mRNA amount, and represented as the mean ± SEM. (n = 9), (###p < 0.001, ##p < 0.01, #p < 0.05, *** p < 0.001 and ** p < 0.01 compared to vehicle; §§p < 0.001 compared to TcdA). (f) qRT-PCR analysis of zebrafish CXCL8 (IL-8) after 2.5 µg/mL TcdA or 8 µg/mL TcdB administration. Data, normalized to the β-Actin mRNA amount, are represented as the mean ± SEM. (n = 9), (###p < 0.001, *** p < 0.001 and ** p < 0.01 compared to vehicle).

Acknowledgments
This image is the copyrighted work of the attributed author or publisher, and ZFIN has permission only to display this image to its users. Additional permissions should be obtained from the applicable author or publisher of the image. Full text @ Cells