
- Title
-
The oxidative stress responses caused by phthalate acid esters increases mRNA abundance of base excision repair (BER) genes in vivo and in vitro
- Authors
- Lu, C., Luo, J., Liu, Y., Yang, X.
- Source
- Full text @ Ecotoxicol. Environ. Saf.
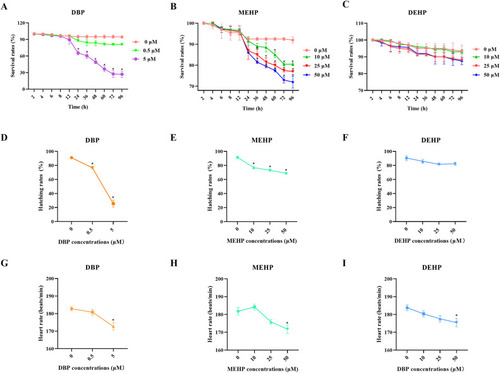
Fig. 1. The survival rates, hatching rates, and heart rates of zebrafish larvae after exposure to PAEs. (A−C) Survival rates of zebrafish larvae after exposure to PAEs for 2–96 h (n = 100 larvae with six replicates for each concentration). (D-F) Hatching rates of zebrafish larvae after exposure to PAEs for 72 h (n = 100 larvae with six replicates for each concentration). (G-I) Heart rates of randomly selected zebrafish larvae after exposure to PAEs for 72 h (n = 20). All values are presented as mean ± SEM. Significant differences between exposure groups and control groups were indicated by *p < 0.05. |
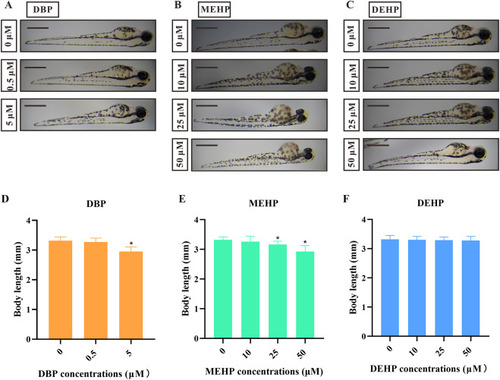
Fig. 2. The effects of different PAE exposures on body length in zebrafish larvae. (A−C) Representative images of zebrafish larvae after 72-h DBP (A), MEHP (B), and DEHP (C) exposures with different concentrations. (D−F) The quantification of body length of zebrafish larvae after 72 h DBP (E), MEHP (E), and DEHP (F) exposures with different concentrations (n = 5 larvae with six replicates for each concentration). Scale bars, 0.5 mm. All values are presented as mean ± SEM. Significant differences between exposure groups and control groups were indicated by *p < 0.05. |
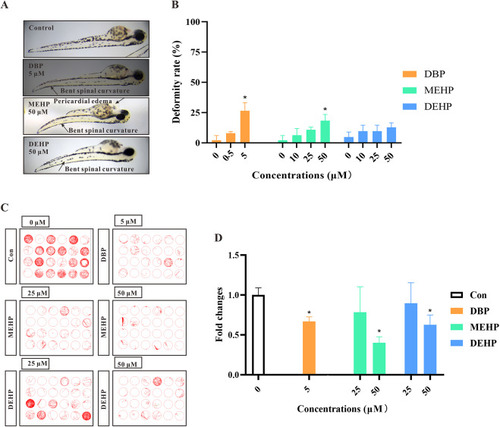
Fig. 3. The deformity rates and behavioral abilities of zebrafish larvae after exposure to PAEs in zebrafish. (A) The deformity of zebrafish larvae after PAEs exposure. (B) Quantification of PAEs-treated zebrafish larvae at different concentrations for 72 h (n = 5 larvae with six replicates for each concentration). (C) Moving track graphs of zebrafish larvae at 96 h in different PAE-treated or control groups. Lines of different colors represent different moving speeds during the track (green: 4–20 mm/s; red: >20 mm/s). (D) The behavioral ability of zebrafish larvae treated with PAEs at different concentrations (n = 4 larvae with six replicates for each concentration). All values are presented as mean ± SEM. Significant differences between exposure groups and control groups were indicated by *p < 0.05. |
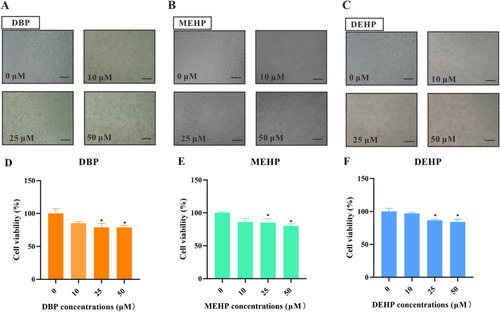
Fig. 4. PAEs exposure induces cytotoxicity in HEK293T cells. Representative images (A−C) and quantification (D−E) of HEK293T cells treated with different concentrations of PAEs for 24 h. Scale bars, 100 µm. All values are presented as mean ± SEM of six replicates samples. Significant differences between exposure groups and control groups were indicated by *p < 0.05. |
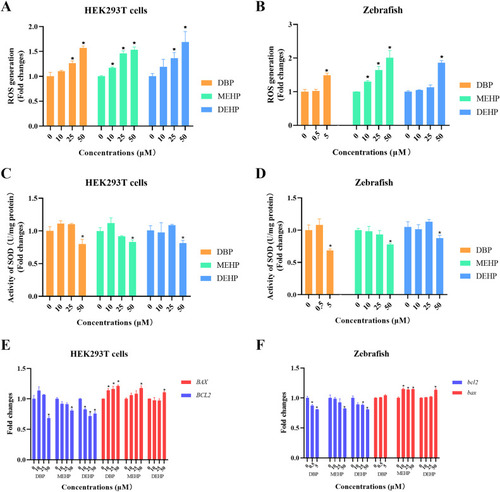
Fig. 5. The determinations of ROS accumulation, SOD activities, and apoptosis in vivo and in vitro after PAEs exposure. (A, B) The determination of ROS levels in zebrafish larvae and HEK293T cells treated with PAEs for 24 h. (C, D) The activation of SOD in vivo and vitro treated with PAEs for 24 h. (E, F) The mRNA levels of the apoptosis-related genes in zebrafish larvae and HEK293T cells treated with PAEs at different concentrations for 24 h. n = 30 zebrafish larvae with three replicates for each concentration. All values are presented as mean ± SEM. Significant differences between exposure groups and control groups were indicated by *p < 0.05. |
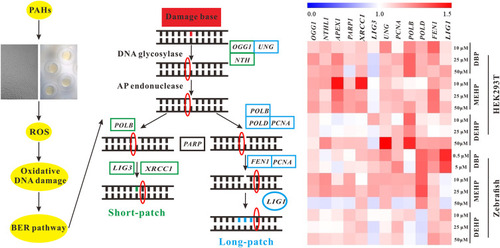
Fig. 6. Schematic illustration of BER pathway in eukaryotes. The pathway was taken from the KEGG database (https://www.kegg.jp/kegg/pathway.html). Green indicates the defined genes functioning in zebrafish/human short-patch BER pathway, while blue refers to the defined genes that are involved in zebrafish/human long-patch BER pathway. Key BER pathway genes were detected by qRT-PCR, and the fold changes were analyzed by the program MeV (MultiExperiment Viewer) v.4.9.0. |
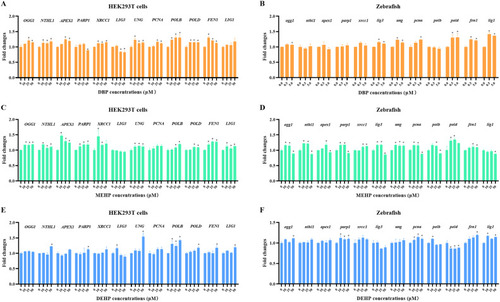
Fig. 7. The regulation of mRNA levels of BER pathway-related genes in vivo and vitro after PAEs exposures. The mRNA levels of key genes of BER pathway in zebrafish larvae and HEK293T cells treated with DBP (A and B), MEHP (C and D), and DEHP (E and F) at different concentrations for 24 h. n = 30 zebrafish larvae with three replicates for each concentration. All values are presented as mean ± SEM. Significant differences between exposure groups and control groups were indicated by *p < 0.05. |