
|
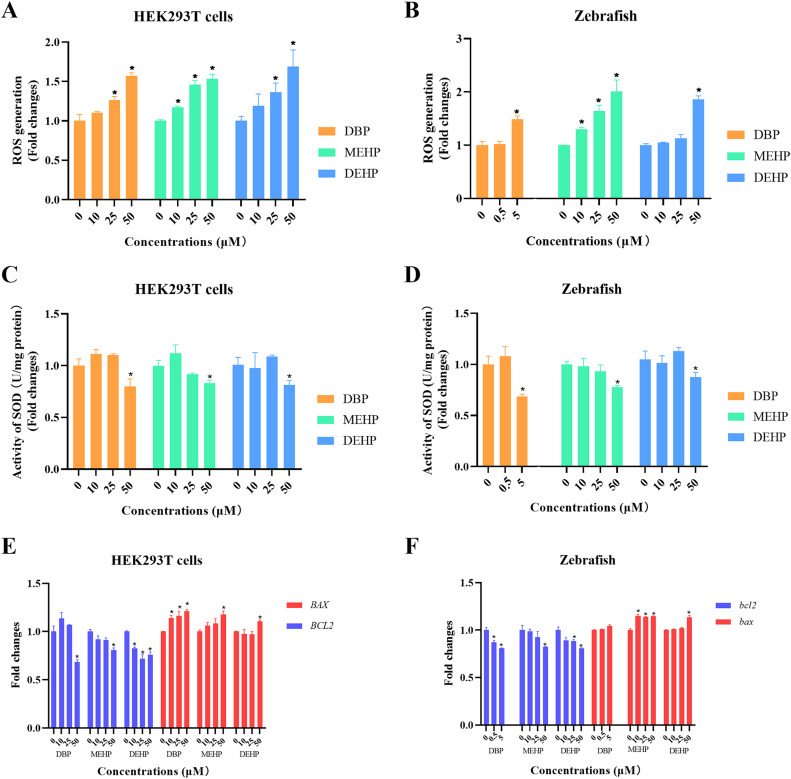
Fig. 5 Fig. 5. The determinations of ROS accumulation, SOD activities, and apoptosis in vivo and in vitro after PAEs exposure. (A, B) The determination of ROS levels in zebrafish larvae and HEK293T cells treated with PAEs for 24 h. (C, D) The activation of SOD in vivo and vitro treated with PAEs for 24 h. (E, F) The mRNA levels of the apoptosis-related genes in zebrafish larvae and HEK293T cells treated with PAEs at different concentrations for 24 h. n = 30 zebrafish larvae with three replicates for each concentration. All values are presented as mean ± SEM. Significant differences between exposure groups and control groups were indicated by *p < 0.05.