
Image
|
Figure Caption
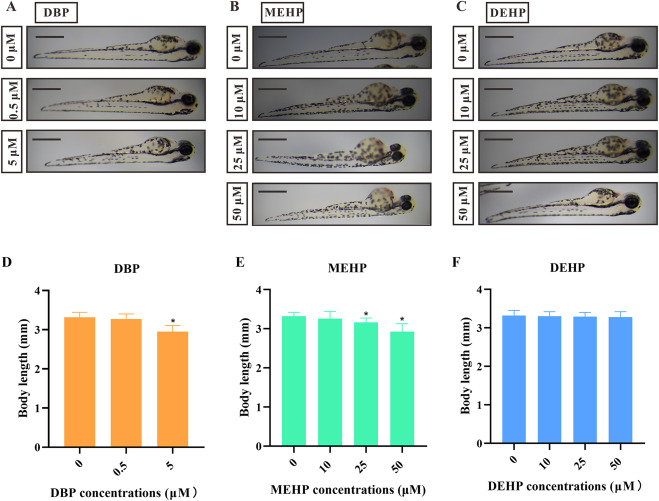
Fig. 2 Fig. 2. The effects of different PAE exposures on body length in zebrafish larvae. (A−C) Representative images of zebrafish larvae after 72-h DBP (A), MEHP (B), and DEHP (C) exposures with different concentrations. (D−F) The quantification of body length of zebrafish larvae after 72 h DBP (E), MEHP (E), and DEHP (F) exposures with different concentrations (n = 5 larvae with six replicates for each concentration). Scale bars, 0.5 mm. All values are presented as mean ± SEM. Significant differences between exposure groups and control groups were indicated by *p < 0.05.
Acknowledgments
This image is the copyrighted work of the attributed author or publisher, and
ZFIN has permission only to display this image to its users.
Additional permissions should be obtained from the applicable author or publisher of the image.
Full text @ Ecotoxicol. Environ. Saf.