
|
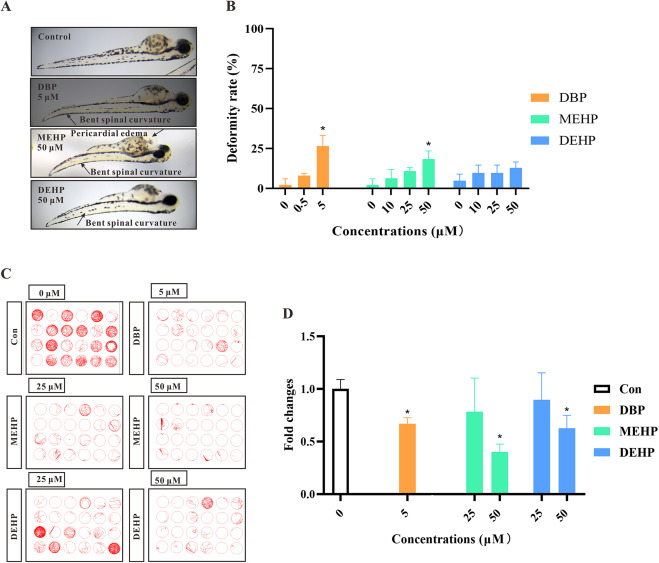
Fig. 3 Fig. 3. The deformity rates and behavioral abilities of zebrafish larvae after exposure to PAEs in zebrafish. (A) The deformity of zebrafish larvae after PAEs exposure. (B) Quantification of PAEs-treated zebrafish larvae at different concentrations for 72 h (n = 5 larvae with six replicates for each concentration). (C) Moving track graphs of zebrafish larvae at 96 h in different PAE-treated or control groups. Lines of different colors represent different moving speeds during the track (green: 4–20 mm/s; red: >20 mm/s). (D) The behavioral ability of zebrafish larvae treated with PAEs at different concentrations (n = 4 larvae with six replicates for each concentration). All values are presented as mean ± SEM. Significant differences between exposure groups and control groups were indicated by *p < 0.05.