
|
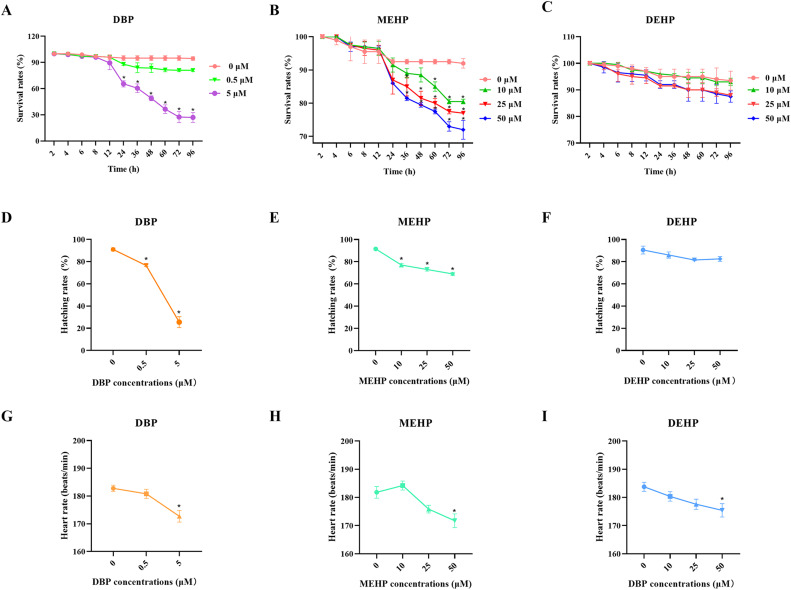
Fig. 1 Fig. 1. The survival rates, hatching rates, and heart rates of zebrafish larvae after exposure to PAEs. (A−C) Survival rates of zebrafish larvae after exposure to PAEs for 2–96 h (n = 100 larvae with six replicates for each concentration). (D-F) Hatching rates of zebrafish larvae after exposure to PAEs for 72 h (n = 100 larvae with six replicates for each concentration). (G-I) Heart rates of randomly selected zebrafish larvae after exposure to PAEs for 72 h (n = 20). All values are presented as mean ± SEM. Significant differences between exposure groups and control groups were indicated by *p < 0.05.