
Image
|
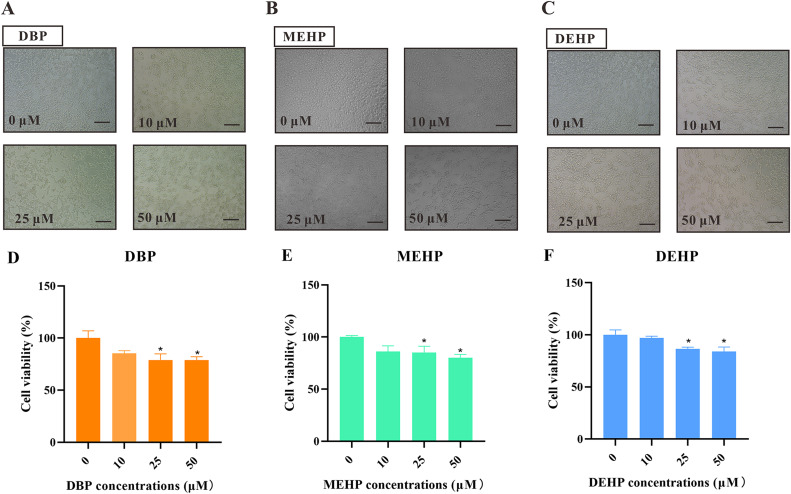
Figure Caption
Fig. 4 Fig. 4. PAEs exposure induces cytotoxicity in HEK293T cells. Representative images (A−C) and quantification (D−E) of HEK293T cells treated with different concentrations of PAEs for 24 h. Scale bars, 100 µm. All values are presented as mean ± SEM of six replicates samples. Significant differences between exposure groups and control groups were indicated by *p < 0.05.
Acknowledgments
This image is the copyrighted work of the attributed author or publisher, and
ZFIN has permission only to display this image to its users.
Additional permissions should be obtained from the applicable author or publisher of the image.
Full text @ Ecotoxicol. Environ. Saf.