
Image
|
Figure Caption
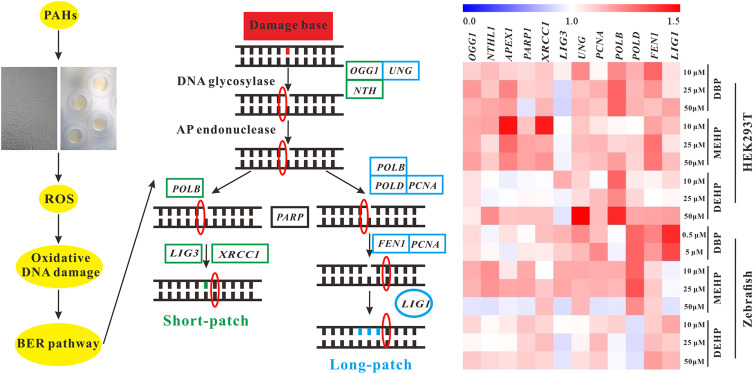
Fig. 6 Fig. 6. Schematic illustration of BER pathway in eukaryotes. The pathway was taken from the KEGG database (https://www.kegg.jp/kegg/pathway.html). Green indicates the defined genes functioning in zebrafish/human short-patch BER pathway, while blue refers to the defined genes that are involved in zebrafish/human long-patch BER pathway. Key BER pathway genes were detected by qRT-PCR, and the fold changes were analyzed by the program MeV (MultiExperiment Viewer) v.4.9.0.
Acknowledgments
This image is the copyrighted work of the attributed author or publisher, and
ZFIN has permission only to display this image to its users.
Additional permissions should be obtained from the applicable author or publisher of the image.
Full text @ Ecotoxicol. Environ. Saf.