
- Title
-
Increased apoptosis, reduced Wnt/β-catenin signaling, and altered tail development in zebrafish embryos exposed to a human-relevant chemical mixture
- Authors
- Smirnova, A., Mentor, A., Ranefall, P., Bornehag, C.G., Brunström, B., Mattsson, A., Jönsson, M.
- Source
- Full text @ Chemosphere
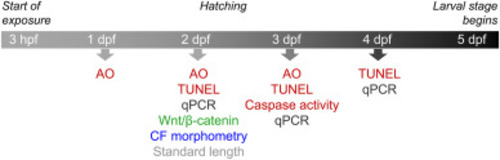
Fig. 1. Timeline for the examination of effects on apoptosis and Wnt/β-catenin signaling in developing zebrafish. Apoptosis was studied by three methods, i.e., acridine orange staining (AO), terminal deoxynucleotidyl transferase dUTP nick end labeling (TUNEL), and caspase 3-like activity assay (Caspase activity). Wnt/β-catenin signaling was assayed in the caudal fin using a transgenic zebrafish line, expressing an EGFP reporter at β-catenin-regulated promoters. Caudal fin (CF) morphometry and standard length measurements were performed by image analysis. Transcript levels of genes related to apoptosis and oxidative stress were determined by qPCR. |

Fig. 2. Wnt/β-catenin-regulated EGFP fluorescence in the transgenic zebrafish and effects of XAV939 and Mixture G. A) Light and fluorescence microscopy images showing an unexposed zebrafish embryo carrying the Tcf/Lef-linked EGFP reporter. EGFP fluorescence (green or light in the dark field images) indicates the location of active Wnt/β-catenin signaling. B) The total fluorescence within a circular area centered on the fin was quantified by automated imaging analysis using CellProfiler. C-D) The graphs show results from individual embryos exposed in 24-well plates to vehicle (0.01% DMSO, denoted “0”) or XAV939 (10 nM), or vehicle or Mixture G (20 or 100x hsc). Exposure started at 3-4 hpf and at 54-60 hpf, the caudal fins were photographed by light- and fluorescence microscopy. The results are expressed as percentages of the respective DMSO group mean (hatched line). Each data point represents one fish and the solid lines group means. Statistically significant differences between control and exposed groups were determined using C) t test with Welch’s correction (n=18-19) and D) one-way ANOVA followed by Dunnett’s test (n=23-24) and are indicated by ∗ p<0.05 and ∗∗∗ p<0.001. |

Fig. 3. Effects of XAV939 and Mixture G on the caudal fin area and the Wnt/β-catenin-regulated fluorescence in this area in transgenic zebrafish embryos. A) The images show the EGFP fluorescence in typical embryos exposed to DMSO and Mixture G (100x hsc) and depict the fin area (“A”, enclosed by a hatched line) in which the florescence was measured; “c” is equal to “height c” in Fig. 4A. The graphs show effects on the size of A measured in pixels (B and E), the mean (C and F), and total (D and G) fluorescence in A measured as pixel intensity. Exposure is described in Fig. 2. The results are expressed as percentages of the respective DMSO control means (hatched line). Each data point represents one fish and the solid lines indicate group means. Statistically significant differences versus the respective DMSO group were determined using one-tailed student’s unpaired t test (B), Mann-Whitney test (C) and t test with Welch correction (D) in the XAV939 experiment (n=18-19) and using Kruskal-Wallis test followed by Dunn’s test (E) and one-way ANOVA followed by Dunnett’s test (F-G) in the Mixture G experiment (n=23-24). ∗ p<0.05 and ∗∗∗ p<0.001. |
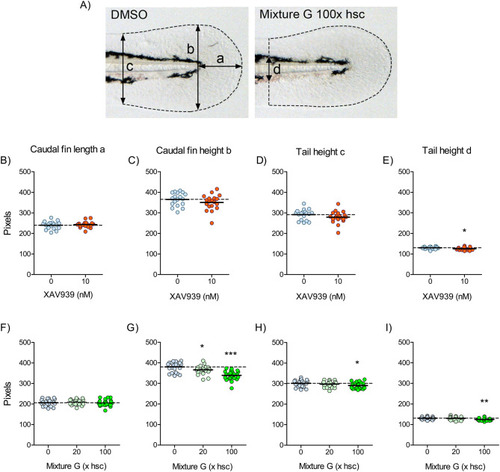
Fig. 4. Effects of XAV939 and Mixture G on the morphology of the zebrafish embryo caudal fin. A) The images show typical embryos exposed to DMSO and Mixture G (100x hsc) and the arrows indicate the length (a) and heights (b, c and d) measured in the fin. B-I) The graphs show the effects of XAV939 (B-E) and Mixture G (F-I) on a, b, c, and d. Exposure is described in Fig. 2. The results are expressed as percentages of the respective DMSO control mean (hatched line). Each data point represents one fish and the solid lines indicate group means. Statistically significant differences compared with the DMSO group were determined using student’s unpaired t test in the XAV939 experiment (n=18-19) and one-way ANOVA followed by Dunnett’s test in the Mixture G experiment (n=23-24). ∗ p≤0.05, ∗∗ p≤0.01, and ∗∗∗ p≤0.001. |
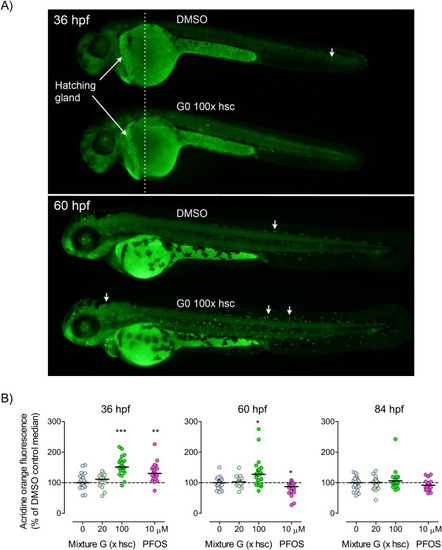
Fig. 5. Effects of Mixture G and PFOS on apoptosis analyzed by acridine orange staining. A) The images show localization of acridine orange staining (representing apoptosis) at ca 36 and 60 hpf with arrows indicating examples of stained cells. B) The graphs show the relative quantity of acridine orange fluorescence as measured in supernatants of homogenized embryos at 36, 60, and 84 hpf. The embryos were exposed in groups of four in 12-well plates to vehicle (0.01% DMSO; “0”), Mixture G (20 or 100x hsc), or PFOS (10 µM). Exposure started at 3 hpf, The upper panel in A was made from two images of the same individual taken at different focal planes and merged at the dotted line. The Mixture-G-exposed embryo shown in the lower panel in A was among those having the largest number of visible stained cells. Data shown in the graphs are expressed as percentages of the respective DMSO control medians (hatched line). Each data point represents one fish and the solid lines indicate group medians. Statistically significant differences between the DMSO control and exposed groups were determined using Kruskal-Wallis test followed by Dunn’s test (n=15-24). ∗ p≤0.05, ∗∗ p≤0.01, and ∗∗∗ p≤0.001. |
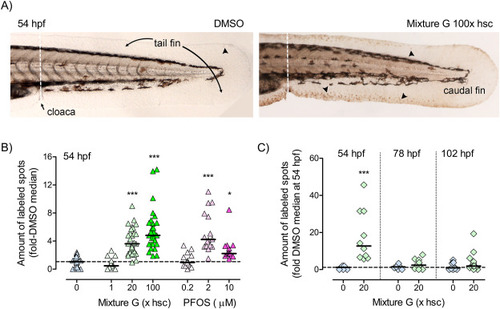
Fig. 6. Effects of Mixture G and PFOS on apoptosis analyzed by TUNEL.A) The images show examples of terminal deoxynucleotidyl transferase dUTP nick end labeling (TUNEL) in the tail fins of zebrafish embryos exposed to vehicle (0.01% DMSO; left panel) or Mixture G at 100x hsc (right panel). The arrow heads indicate examples of labeled spots. The graphs show the relative amount of labeled spots B) at 54 hpf in embryos exposed to vehicle (”0”), Mixture G at 1, 20 or 100x hsc, or PFOS at 0.2, 2 or 10 µM and C) at 54, 78, and 102 hpf in embryos exposed to vehicle or Mixture G at 20x hsc. Embryo groups were exposed in triplicate glass petri dishes with exposure starting at 3 hpf. At the time for analysis all embryos of the same exposure were pooled to be fixed and processed for TUNEL. Data in B are from two combined experiments (n=21-35 embryos from 3 or 6 replicate dishes) and data in C are from embryos collected from the same triplicate dishes on three consecutive days (n=8-12 embryos). Data were normalized to the DMSO control means at 54 hpf. Each dot represents data from one embryo and the solid lines represent the group medians. The horizontal hatched lines indicate the DMSO medians at 54 hpf. Statistically significant differences between the DMSO and exposed groups were determined using Kruskal-Wallis test followed by Dunn’s test for selected pairs and are indicated by ∗ p≤0.05 and ∗∗∗ p≤0.001. |
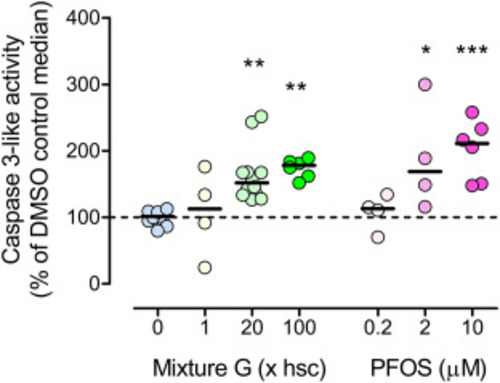
Fig. 7. Effect of Mixture G and PFOS on apoptosis analyzed by caspase 3-like activity assay. Groups of 20–100 embryos were exposed in glass petri dishes to vehicle (0.01% DMSO, “0”), Mixture G (1, 20, or 100x hsc), or PFOS (0.2, 2, or 10 μM). Exposure started at 3 hpf and caspase 3 activity was analyzed at 78 hpf. In the graph each data point represents a replicate composed of 40 pooled embryos sampled from one large or two smaller dishes. Up to 3 replicates were collected from each of 3 different experiments (n = 4–12). Not all exposure groups could be included in each experiment due to the large size of the experiment. Data are expressed as percentages of the control median value (hatched line). The solid lines indicate group medians. There was no statistically significant difference among groups with the same exposures from different experiments, as assessed by one-way ANOVA followed by Dunnett’s test. Statistically significant differences between the DMSO control and exposed groups were determined using Kruskal-Wallis test followed by Dunn’s test (∗ p≤0.05, ∗∗ p≤0.01, and ∗∗∗p ≤ 0.001). |