
|
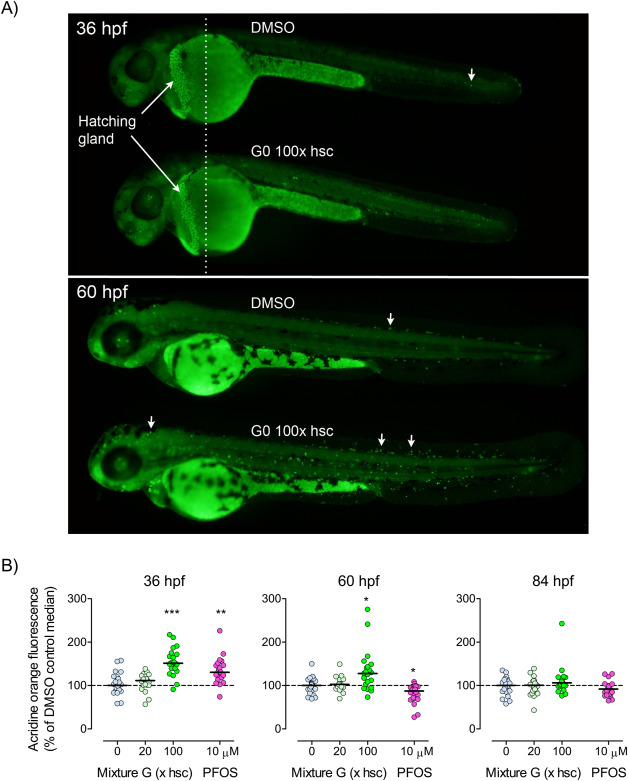
Fig. 5 Fig. 5. Effects of Mixture G and PFOS on apoptosis analyzed by acridine orange staining. A) The images show localization of acridine orange staining (representing apoptosis) at ca 36 and 60 hpf with arrows indicating examples of stained cells. B) The graphs show the relative quantity of acridine orange fluorescence as measured in supernatants of homogenized embryos at 36, 60, and 84 hpf. The embryos were exposed in groups of four in 12-well plates to vehicle (0.01% DMSO; “0”), Mixture G (20 or 100x hsc), or PFOS (10 µM). Exposure started at 3 hpf, The upper panel in A was made from two images of the same individual taken at different focal planes and merged at the dotted line. The Mixture-G-exposed embryo shown in the lower panel in A was among those having the largest number of visible stained cells. Data shown in the graphs are expressed as percentages of the respective DMSO control medians (hatched line). Each data point represents one fish and the solid lines indicate group medians. Statistically significant differences between the DMSO control and exposed groups were determined using Kruskal-Wallis test followed by Dunn’s test (n=15-24). ∗ p≤0.05, ∗∗ p≤0.01, and ∗∗∗ p≤0.001.