
|
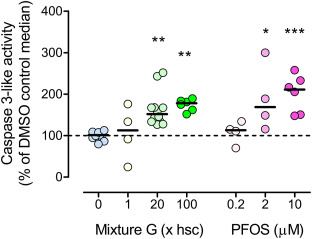
Fig. 7 Fig. 7. Effect of Mixture G and PFOS on apoptosis analyzed by caspase 3-like activity assay. Groups of 20–100 embryos were exposed in glass petri dishes to vehicle (0.01% DMSO, “0”), Mixture G (1, 20, or 100x hsc), or PFOS (0.2, 2, or 10 μM). Exposure started at 3 hpf and caspase 3 activity was analyzed at 78 hpf. In the graph each data point represents a replicate composed of 40 pooled embryos sampled from one large or two smaller dishes. Up to 3 replicates were collected from each of 3 different experiments (n = 4–12). Not all exposure groups could be included in each experiment due to the large size of the experiment. Data are expressed as percentages of the control median value (hatched line). The solid lines indicate group medians. There was no statistically significant difference among groups with the same exposures from different experiments, as assessed by one-way ANOVA followed by Dunnett’s test. Statistically significant differences between the DMSO control and exposed groups were determined using Kruskal-Wallis test followed by Dunn’s test (∗ p≤0.05, ∗∗ p≤0.01, and ∗∗∗p ≤ 0.001).