
|
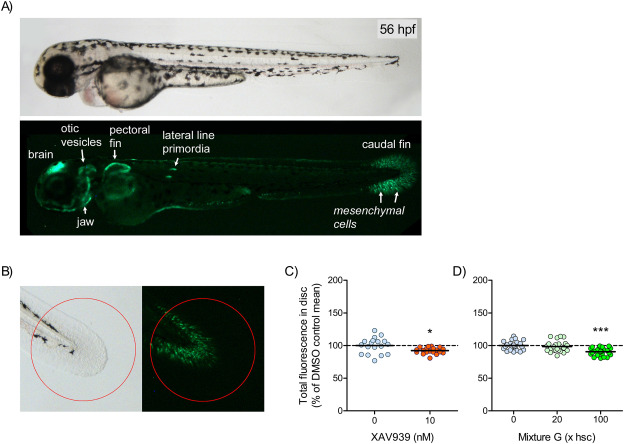
Fig. 2 Fig. 2. Wnt/β-catenin-regulated EGFP fluorescence in the transgenic zebrafish and effects of XAV939 and Mixture G. A) Light and fluorescence microscopy images showing an unexposed zebrafish embryo carrying the Tcf/Lef-linked EGFP reporter. EGFP fluorescence (green or light in the dark field images) indicates the location of active Wnt/β-catenin signaling. B) The total fluorescence within a circular area centered on the fin was quantified by automated imaging analysis using CellProfiler. C-D) The graphs show results from individual embryos exposed in 24-well plates to vehicle (0.01% DMSO, denoted “0”) or XAV939 (10 nM), or vehicle or Mixture G (20 or 100x hsc). Exposure started at 3-4 hpf and at 54-60 hpf, the caudal fins were photographed by light- and fluorescence microscopy. The results are expressed as percentages of the respective DMSO group mean (hatched line). Each data point represents one fish and the solid lines group means. Statistically significant differences between control and exposed groups were determined using C) t test with Welch’s correction (n=18-19) and D) one-way ANOVA followed by Dunnett’s test (n=23-24) and are indicated by ∗ p<0.05 and ∗∗∗ p<0.001.