
|
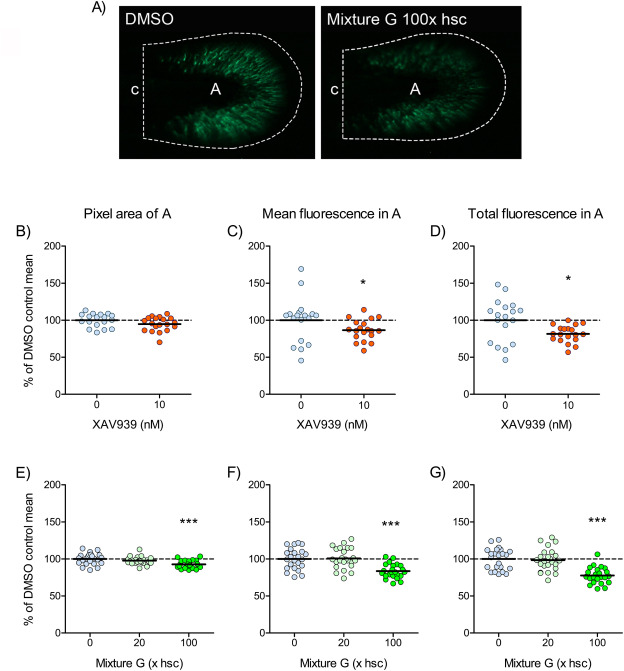
Fig. 3 Fig. 3. Effects of XAV939 and Mixture G on the caudal fin area and the Wnt/β-catenin-regulated fluorescence in this area in transgenic zebrafish embryos. A) The images show the EGFP fluorescence in typical embryos exposed to DMSO and Mixture G (100x hsc) and depict the fin area (“A”, enclosed by a hatched line) in which the florescence was measured; “c” is equal to “height c” in Fig. 4A. The graphs show effects on the size of A measured in pixels (B and E), the mean (C and F), and total (D and G) fluorescence in A measured as pixel intensity. Exposure is described in Fig. 2. The results are expressed as percentages of the respective DMSO control means (hatched line). Each data point represents one fish and the solid lines indicate group means. Statistically significant differences versus the respective DMSO group were determined using one-tailed student’s unpaired t test (B), Mann-Whitney test (C) and t test with Welch correction (D) in the XAV939 experiment (n=18-19) and using Kruskal-Wallis test followed by Dunn’s test (E) and one-way ANOVA followed by Dunnett’s test (F-G) in the Mixture G experiment (n=23-24). ∗ p<0.05 and ∗∗∗ p<0.001.