FIGURE SUMMARY
Title

The DNA methyltransferase DNMT3A contributes to autophagy long-term memory

Authors
González-Rodríguez, P., Cheray, M., Füllgrabe, J., Salli, M., Engskog-Vlachos, P., Keane, L., Cunha, V., Lupa, A., Li, W., Ma, Q., Dreij, K., Rosenfeld, M.G., Joseph, B.
Source
Full text @ Autophagy

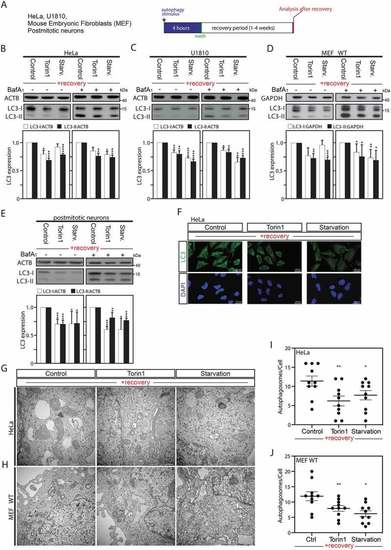
Autophagy induction is associated with a sustained downregulation of MAP1LC3 protein expression after a recovery period. (A) Illustrative pipeline of the “previously-autophagy exposed cells” generation and analysis after a recovery period. (B–E) Immunoblot analysis and quantification of LC3-I and LC3-II expression versus ACTB or GAPDH in HeLa cells (B), U1810 cells (C), wild-type (WT) MEF cells (D), or post-mitotic neurons (E), starved (Starv.), pretreated with torin1, or DMSO (used as control) for 4 h and thereafter left to recover and analyze after 2 weeks (B and C), one week (D), or 8 d (E) under normal cell culture conditions. Treatment with the late inhibitor of autophagy bafilomycin A1 (BafA1) before sample collection validates that the observed overall decrease in LC3 expression was not the result of an increase in autophagic flux (B to E). (F) Immunofluorescence confocal microscopy imaging of endogenous LC3 in HeLa cells after 2-week recovery period. (G to J) Ultrastructural analysis by electron microscopy of HeLa cells (G and I) or MEF cells (H and J), starved, pretreated with torin1, or DMSO (used as control) for 4 h and thereafter left to recover and analyze after 2 weeks (HeLa cells), or one week (MEF cells). Panels I and J are quantification of number of autophagosomes per cell. 10 cells were counted per conditions. All values are a mean of at least 3 independent experiments ± SEM and considered significant for *p < 0.05, **p < 0.01, ***p < 0.001, ****p < 0.0001. n.s., not significant for the indicated comparison. (B-E, n = 3–5; I-J, n = 10)

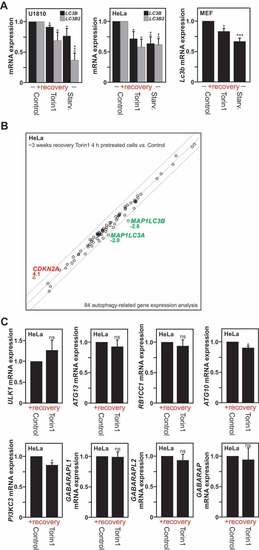
Transcriptional repression of the MAP1LC3 genes is observed upon autophagy induction. (A) MAP1LC3B and MAP1LC3B2 isoforms mRNA expression measured by RT-qPCR in previously autophagy-exposed U1810, HeLa and MEF cells processed as described in Fig. S1A and analyzed after a specific recovery period. (B) Analysis of mRNA expression of 84 autophagy-related genes (from a RT-qPCR based gene array) in HeLa cells following a 3 weeks recovery-period after an initial torin1 or DMSO (used as control) treatment for 4 h. Representation of n = 3 independent experiments. (C) Analysis by RT-qPCR of mRNA expression of ATG10, ATG13, PIK3C3, RB1CC1, ULK1, GAPARAPL1, GABARAPL2 and GABARAP genes in HeLa cells processed as described in panel B. All values are means of at least 3 independent experiments ± SEM and considered significant for *p < 0.05, **p < 0.01, ***p < 0.001. n.s., not significant for the indicated comparison. (A, n = 4–6; B and C, n = 3)

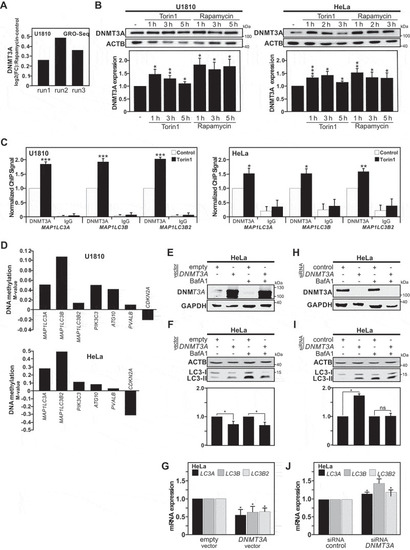
DNMT3A recruitment and DNA methylation occur at the MAP1LC3 loci in response to autophagy stimulation. (A) Upregulation of DNMT3A gene transcription upon autophagy induction was found in previously published GRO-seq (Global Run-On Sequencing) analysis of rapamycin-treated U1810 cells for 2 or 8 h [8]. Data are presented as log2 (fold-change) (log2[FC]) of normalized unit of DNMT3A transcript expression for rapamycin-treated cells versus control cells, for each independent experimental replicate/run (n = 3). (B) Immunoblot analysis of DNMT3A protein expression in U1810 and HeLa cells upon rapamycin or torin1 treatments at indicated time points. The graphs show quantification for DNMT3A versus ACTB expression in Hela and U1810 cells when compared to the DMSO treated ones (used as control). Representation of n = 3 independent experiments; mean ± SEM. (C) Chromatin Immunoprecipitation (ChIP) analysis of DNMT3A recruitment on the MALP1LC3 isoforms loci upon induction of autophagy with torin1 in HeLa Cells for 6 h and U1810 cells for 2 h. (D) Analysis of individual CpG site methylation level (using the M-value normalized with the control samples, i.e., log2 ratio of methylated:unmethylated probe intensity) at the ATG10, CDKN2A, PIK3C3, PVALB and MAP1LC3 isoforms loci in cells previously exposed to an autophagy stimulus when compared with non-stimulated control cells (M-value = 0) after 3 weeks recovery period. (E and F) Immunoblot analysis of DNMT3A in HeLa cells upon transfection for 24 h with DNMT3A plasmid or an empty vector (used as control). (E) Immunoblot of LC3-II expression in HeLa cells upon DNMT3A overexpression with and without bafilomycin A1 (BafA1) treatment and (F) quantification of total LC3 expression (LC3-I and LC3-II) versus ACTB levels. (G) Analysis of mRNA expression of MAP1LC3 isoforms when DNMT3A is overexpressed in HeLa Cells compared to the empty vector (used as control) after 24 h post-transfection. (H) Immunoblot of DNMT3A in HeLa cells transfected with a pool of siRNAs against DNMT3A compared with siRNAs control with and without BafA1 treatment and (I) Quantification of total LC3 expression versus ACTB levels. (J) RT-qPCR analysis of MAP1LC3 isoforms expression in HeLa cells upon DNMT3A silencing compared to control. All values are means of at least 3 independent experiments ± SEM and considered significant for *p < 0.05, **p < 0.01, ***p < 0.001. n.s., not significant for the indicated comparison

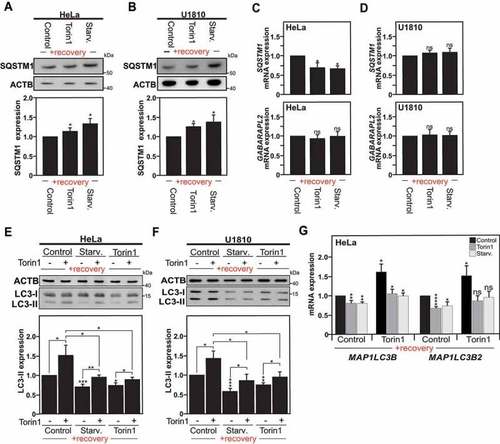
Autophagy is altered in cells previously exposed to an autophagy stimulus. (A and B) Immunoblot analysis of SQSTM1 expression in Hela cells (A), or U1810 cells (B), starved (Starv.), treated with torin1 or DMSO (used as control) for 4 h, and left to recover under normal culture conditions for a two to three weeks period. The graphs show the quantification of SQSTM1 versus ACTB expression in Hela cells (A), and U1810 cells (B). (C and D) SQSTM1 and GABARAPL2 mRNA expression levels measured by RT-qPCR in HeLa cells (C) and U1810 cells (D) previously exposed to an autophagy stimulus or DMSO (used as control) and analyzed at 2 weeks after the first autophagy stimulus. (E and F) Immunoblot and quantification analysis of LC3-II expression in Hela cells (E), or U1810 cells (F), previously exposed to an autophagy stimulus as described in Fig. S1A upon re-stimulation of autophagy with torin1 treatment for 1 h (+) as compared to DMSO treatment used as control (-). G MAP1LC3B and MAP1LC3B2 isoforms mRNA expression measured by RT-qPCR in HeLa cells previously exposed to an autophagy stimulus upon re-stimulation of autophagy with torin1. All values are means of at least 3 independent experiments ± SEM and considered significant for *p < 0.05, **p < 0.01, ***p < 0.001. n.s., not significant for the indicated comparison. (n = 3–6)

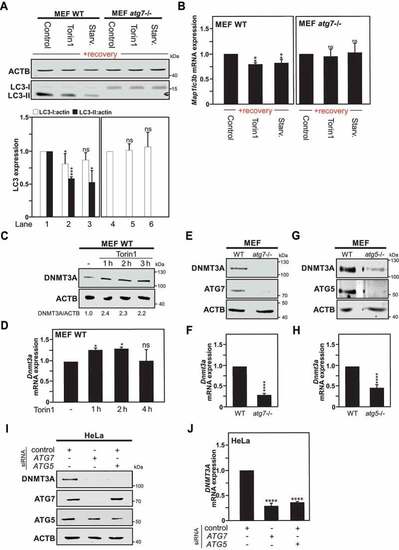
MAP1LC3 downregulation is abrogated in Atg7-deficient Cells. (A) Immunoblot analysis of LC3-I and LC3-II expression in Wild type (WT) and atg7−/- MEF cells starved (Starv.), treated with torin1, or DMSO (used as control) for 4 h, thereafter left to recover for 1 week. The graphs show the quantification of LC3-I and LC3-II versus ACTB expression. (B) Map1lc3b mRNA expression measured by RT-qPCR in previously autophagy-exposed WT and atg7−/- MEF cells processed as described previously in Fig. S1A. (C) Immunoblot of DNMT3A protein expression in WT MEF cells upon torin1 treatment or DMSO (used as control) at the indicated time points. (D) mRNA expression analysis of Dnmt3a level upon torin1 treatment at different time points in WT MEF cells. (E and G) DNMT3A protein expression in atg7−/- MEF cells (E) or atg5−/- MEF cells (G) compared to WT MEF cells. (F and H) Dnmt3a mRNA expression measured by RT-qPCR in atg7−/- MEF cells (F) or atg5−/- MEF cells (H) versus autophagy-proficient cells (WT). (I) Representative immunoblot of 3 independent experiments of DNMT3A, ATG5 and ATG5 expression in HeLa cells after siRNA-mediated ATG5 or ATG7 silencing in HeLa cells after 48 h transfection. (J) DNMT3A mRNA expression measured by RT-qPCR in HeLa cells treated as described in panel I. All values are means of at least 3 independent experiments ± SEM and considered significant for *p < 0.05, **p < 0.01, ***p < 0.001, ****p < 0.0001. n.s., not significant for the indicated comparison. (n = 3)

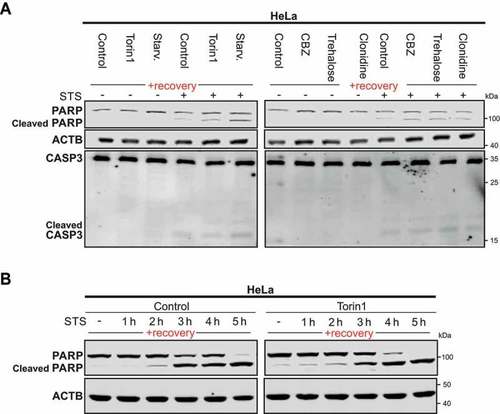
Previously-autophagy exposed cells are sensitized to apoptosis. (A) Representative immunoblot of 3 independent experiments of PARP and CASP3 in Hela cells starved (Starv.), treated with torin1 or MTOR-independent inducers for 4 h, thereafter left to recover for 2 weeks under normal cell culture conditions and treated with staurosporine (STS) for 3 h before harvest. CBZ., carbamazepine. (B) Representative immunoblot of 3 independent experiments of PARP and cleaved-PARP immunoblot of HeLa cells treated for 4 h with DMSO (used as control) and torin1 and left to recover for 2 weeks as previously described in Fig. S1A. Cleaved PARP was analyzed after STS treatment at different time points

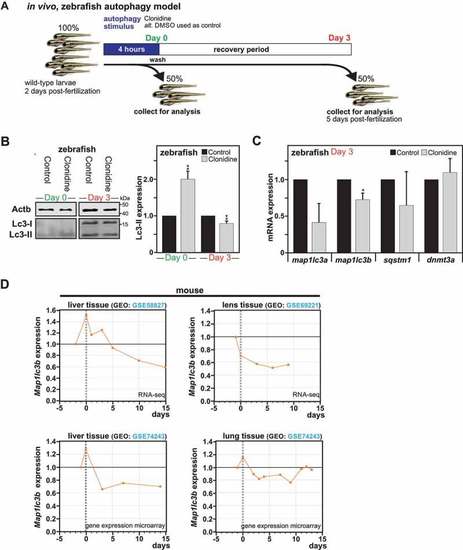
Impact of autophagy on long-term downregulation of MAP1LC3 expression in vivo. (A) Illustration of the experimental setting performed in Zebrafish larvae. (B) Representative immunoblot for LC3-II expression in Zebrafish larvae exposed for 4 h to clonidine or DMSO (used as control), collected directly after exposure (Day 0) or left to recover for 3 d. (B) Quantification of LC3-II versus ACTB expression from Zebrafish larvae at day 0 and day 3. All values are means ± SEM (n = 4, with 30 fish per condition). (C) map1lc3a, map1lc3b, sqstm1 and dnmt3a mRNA expression measured by RT-qPCR in zebrafish after the recovery period (n = 3, with 20 fish per condition). (D) Re-analysis of Map1lc3b gene expression in different mouse tissues such as liver, lens and lung before and after placenta withdrawal from 4 independent genome-wide data sets, with 0 corresponding to time of birth. All values are a means of at least 3 independent experiments ± SEM and considered significant for *p < 0.05, **p < 0.01, n.s., not significant for the indicated comparison

Acknowledgments
This image is the copyrighted work of the attributed author or publisher, and ZFIN has permission only to display this image to its users. Additional permissions should be obtained from the applicable author or publisher of the image. Full text @ Autophagy