IMAGE

Figure 3.

ID
ZDB-IMAGE-210611-76
Source
Figures for González-Rodríguez et al., 2020
Image
Figure Caption

Figure 3.

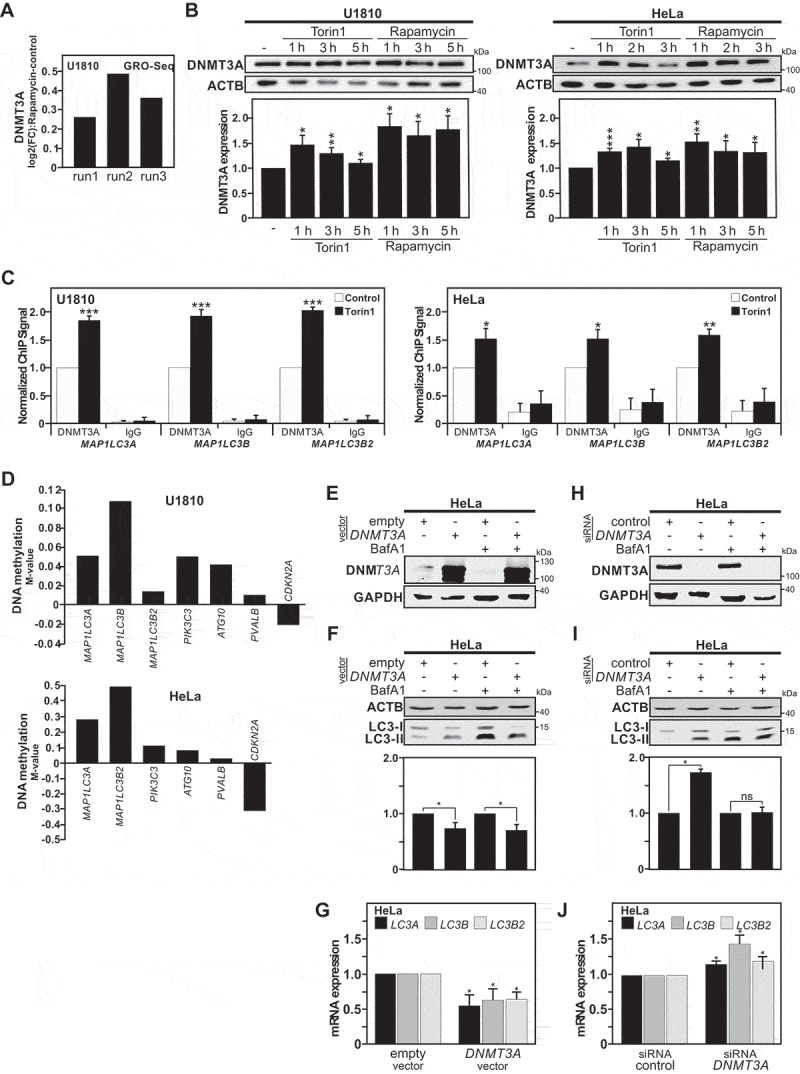
DNMT3A recruitment and DNA methylation occur at the MAP1LC3 loci in response to autophagy stimulation. (A) Upregulation of DNMT3A gene transcription upon autophagy induction was found in previously published GRO-seq (Global Run-On Sequencing) analysis of rapamycin-treated U1810 cells for 2 or 8 h [8]. Data are presented as log2 (fold-change) (log2[FC]) of normalized unit of DNMT3A transcript expression for rapamycin-treated cells versus control cells, for each independent experimental replicate/run (n = 3). (B) Immunoblot analysis of DNMT3A protein expression in U1810 and HeLa cells upon rapamycin or torin1 treatments at indicated time points. The graphs show quantification for DNMT3A versus ACTB expression in Hela and U1810 cells when compared to the DMSO treated ones (used as control). Representation of n = 3 independent experiments; mean ± SEM. (C) Chromatin Immunoprecipitation (ChIP) analysis of DNMT3A recruitment on the MALP1LC3 isoforms loci upon induction of autophagy with torin1 in HeLa Cells for 6 h and U1810 cells for 2 h. (D) Analysis of individual CpG site methylation level (using the M-value normalized with the control samples, i.e., log2 ratio of methylated:unmethylated probe intensity) at the ATG10, CDKN2A, PIK3C3, PVALB and MAP1LC3 isoforms loci in cells previously exposed to an autophagy stimulus when compared with non-stimulated control cells (M-value = 0) after 3 weeks recovery period. (E and F) Immunoblot analysis of DNMT3A in HeLa cells upon transfection for 24 h with DNMT3A plasmid or an empty vector (used as control). (E) Immunoblot of LC3-II expression in HeLa cells upon DNMT3A overexpression with and without bafilomycin A1 (BafA1) treatment and (F) quantification of total LC3 expression (LC3-I and LC3-II) versus ACTB levels. (G) Analysis of mRNA expression of MAP1LC3 isoforms when DNMT3A is overexpressed in HeLa Cells compared to the empty vector (used as control) after 24 h post-transfection. (H) Immunoblot of DNMT3A in HeLa cells transfected with a pool of siRNAs against DNMT3A compared with siRNAs control with and without BafA1 treatment and (I) Quantification of total LC3 expression versus ACTB levels. (J) RT-qPCR analysis of MAP1LC3 isoforms expression in HeLa cells upon DNMT3A silencing compared to control. All values are means of at least 3 independent experiments ± SEM and considered significant for *p < 0.05, **p < 0.01, ***p < 0.001. n.s., not significant for the indicated comparison

Acknowledgments
This image is the copyrighted work of the attributed author or publisher, and ZFIN has permission only to display this image to its users. Additional permissions should be obtained from the applicable author or publisher of the image. Full text @ Autophagy