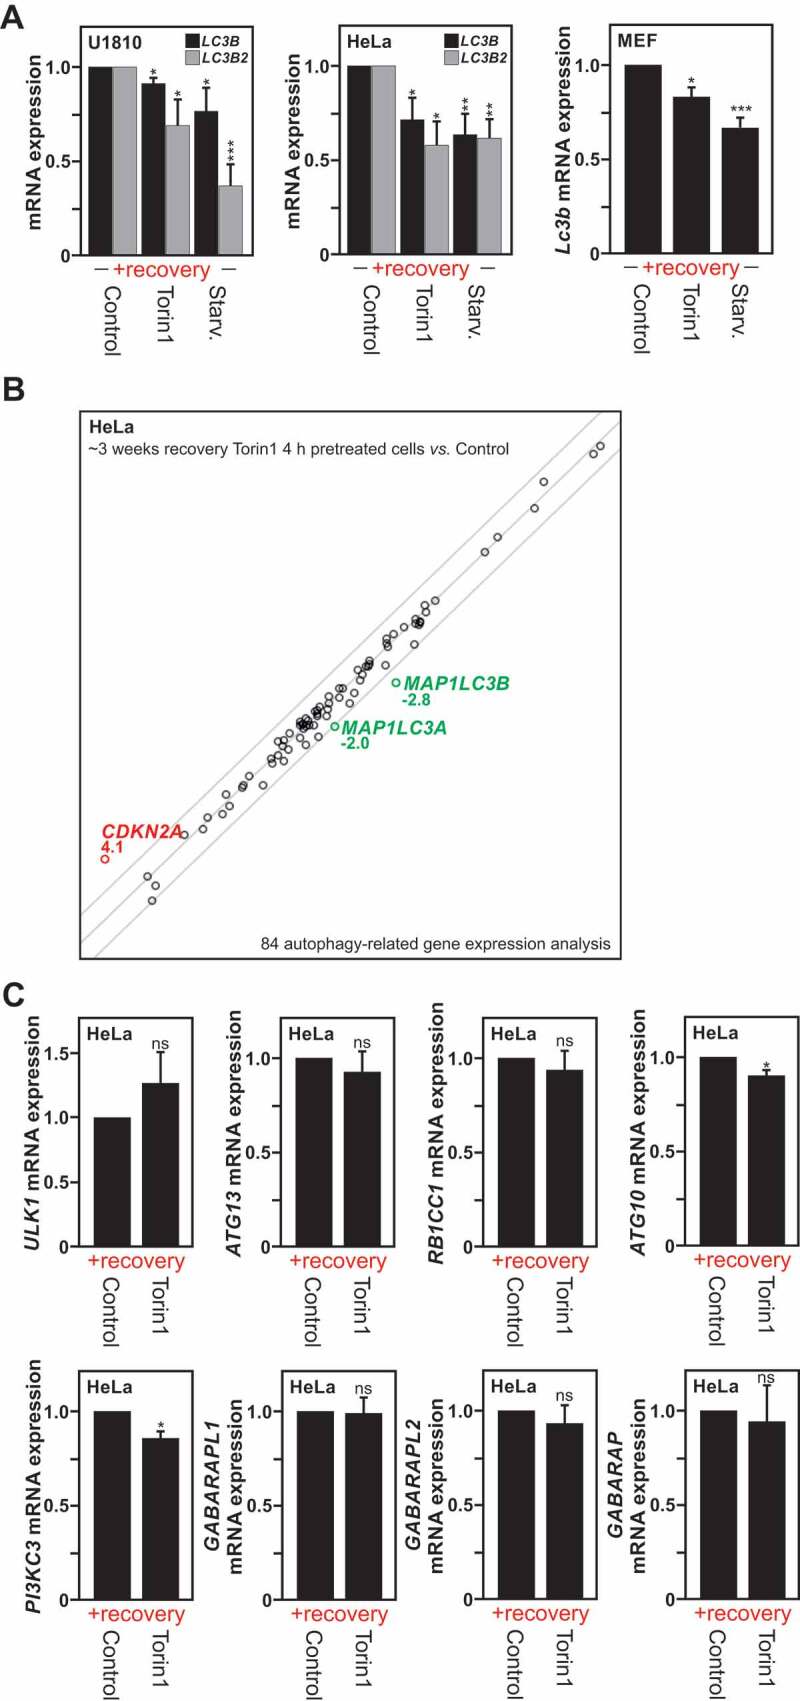
IMAGE

Figure 2.

ID
ZDB-IMAGE-210611-75
Source
Figures for González-Rodríguez et al., 2020
Image
Figure Caption

Figure 2.

Transcriptional repression of the MAP1LC3 genes is observed upon autophagy induction. (A) MAP1LC3B and MAP1LC3B2 isoforms mRNA expression measured by RT-qPCR in previously autophagy-exposed U1810, HeLa and MEF cells processed as described in Fig. S1A and analyzed after a specific recovery period. (B) Analysis of mRNA expression of 84 autophagy-related genes (from a RT-qPCR based gene array) in HeLa cells following a 3 weeks recovery-period after an initial torin1 or DMSO (used as control) treatment for 4 h. Representation of n = 3 independent experiments. (C) Analysis by RT-qPCR of mRNA expression of ATG10, ATG13, PIK3C3, RB1CC1, ULK1, GAPARAPL1, GABARAPL2 and GABARAP genes in HeLa cells processed as described in panel B. All values are means of at least 3 independent experiments ± SEM and considered significant for *p < 0.05, **p < 0.01, ***p < 0.001. n.s., not significant for the indicated comparison. (A, n = 4–6; B and C, n = 3)

Acknowledgments
This image is the copyrighted work of the attributed author or publisher, and ZFIN has permission only to display this image to its users. Additional permissions should be obtained from the applicable author or publisher of the image. Full text @ Autophagy