IMAGE

Figure 5.

ID
ZDB-IMAGE-210611-78
Source
Figures for González-Rodríguez et al., 2020
Image
Figure Caption

Figure 5.

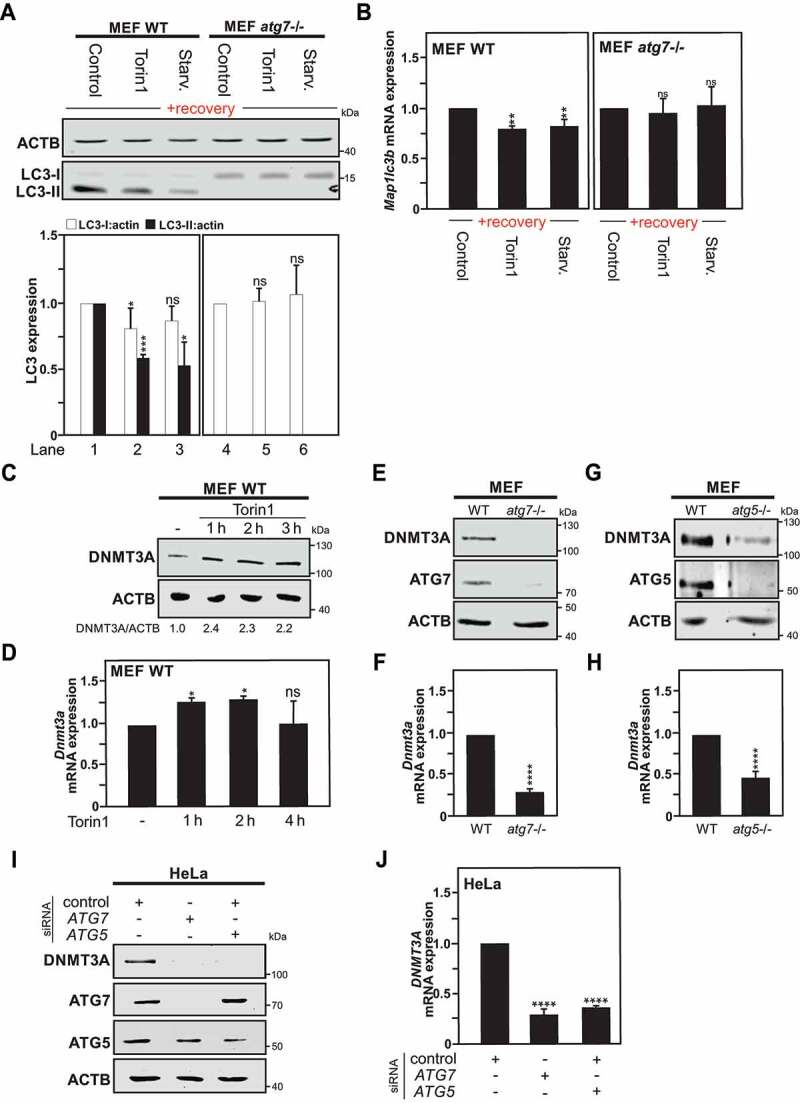
MAP1LC3 downregulation is abrogated in Atg7-deficient Cells. (A) Immunoblot analysis of LC3-I and LC3-II expression in Wild type (WT) and atg7−/- MEF cells starved (Starv.), treated with torin1, or DMSO (used as control) for 4 h, thereafter left to recover for 1 week. The graphs show the quantification of LC3-I and LC3-II versus ACTB expression. (B) Map1lc3b mRNA expression measured by RT-qPCR in previously autophagy-exposed WT and atg7−/- MEF cells processed as described previously in Fig. S1A. (C) Immunoblot of DNMT3A protein expression in WT MEF cells upon torin1 treatment or DMSO (used as control) at the indicated time points. (D) mRNA expression analysis of Dnmt3a level upon torin1 treatment at different time points in WT MEF cells. (E and G) DNMT3A protein expression in atg7−/- MEF cells (E) or atg5−/- MEF cells (G) compared to WT MEF cells. (F and H) Dnmt3a mRNA expression measured by RT-qPCR in atg7−/- MEF cells (F) or atg5−/- MEF cells (H) versus autophagy-proficient cells (WT). (I) Representative immunoblot of 3 independent experiments of DNMT3A, ATG5 and ATG5 expression in HeLa cells after siRNA-mediated ATG5 or ATG7 silencing in HeLa cells after 48 h transfection. (J) DNMT3A mRNA expression measured by RT-qPCR in HeLa cells treated as described in panel I. All values are means of at least 3 independent experiments ± SEM and considered significant for *p < 0.05, **p < 0.01, ***p < 0.001, ****p < 0.0001. n.s., not significant for the indicated comparison. (n = 3)

Acknowledgments
This image is the copyrighted work of the attributed author or publisher, and ZFIN has permission only to display this image to its users. Additional permissions should be obtained from the applicable author or publisher of the image. Full text @ Autophagy