
Figure 4.
- ID
- ZDB-FIG-210611-77
- Publication
- González-Rodríguez et al., 2020 - The DNA methyltransferase DNMT3A contributes to autophagy long-term memory
- Other Figures
- All Figure Page
- Back to All Figure Page
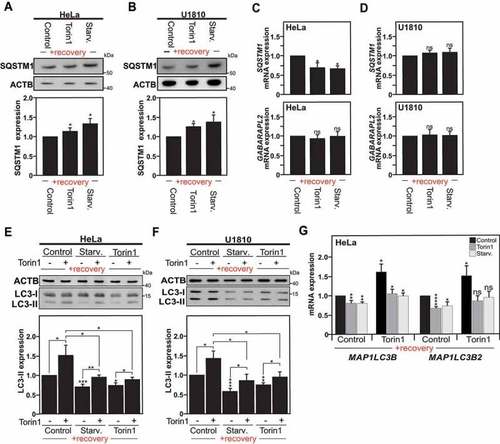
Autophagy is altered in cells previously exposed to an autophagy stimulus. (A and B) Immunoblot analysis of SQSTM1 expression in Hela cells (A), or U1810 cells (B), starved (Starv.), treated with torin1 or DMSO (used as control) for 4 h, and left to recover under normal culture conditions for a two to three weeks period. The graphs show the quantification of SQSTM1 versus ACTB expression in Hela cells (A), and U1810 cells (B). (C and D) SQSTM1 and GABARAPL2 mRNA expression levels measured by RT-qPCR in HeLa cells (C) and U1810 cells (D) previously exposed to an autophagy stimulus or DMSO (used as control) and analyzed at 2 weeks after the first autophagy stimulus. (E and F) Immunoblot and quantification analysis of LC3-II expression in Hela cells (E), or U1810 cells (F), previously exposed to an autophagy stimulus as described in Fig. S1A upon re-stimulation of autophagy with torin1 treatment for 1 h (+) as compared to DMSO treatment used as control (-). G MAP1LC3B and MAP1LC3B2 isoforms mRNA expression measured by RT-qPCR in HeLa cells previously exposed to an autophagy stimulus upon re-stimulation of autophagy with torin1. All values are means of at least 3 independent experiments ± SEM and considered significant for *p < 0.05, **p < 0.01, ***p < 0.001. n.s., not significant for the indicated comparison. (n = 3–6) |