IMAGE

Figure 7.

ID
ZDB-IMAGE-210611-80
Source
Figures for González-Rodríguez et al., 2020
Image
Figure Caption

Figure 7.

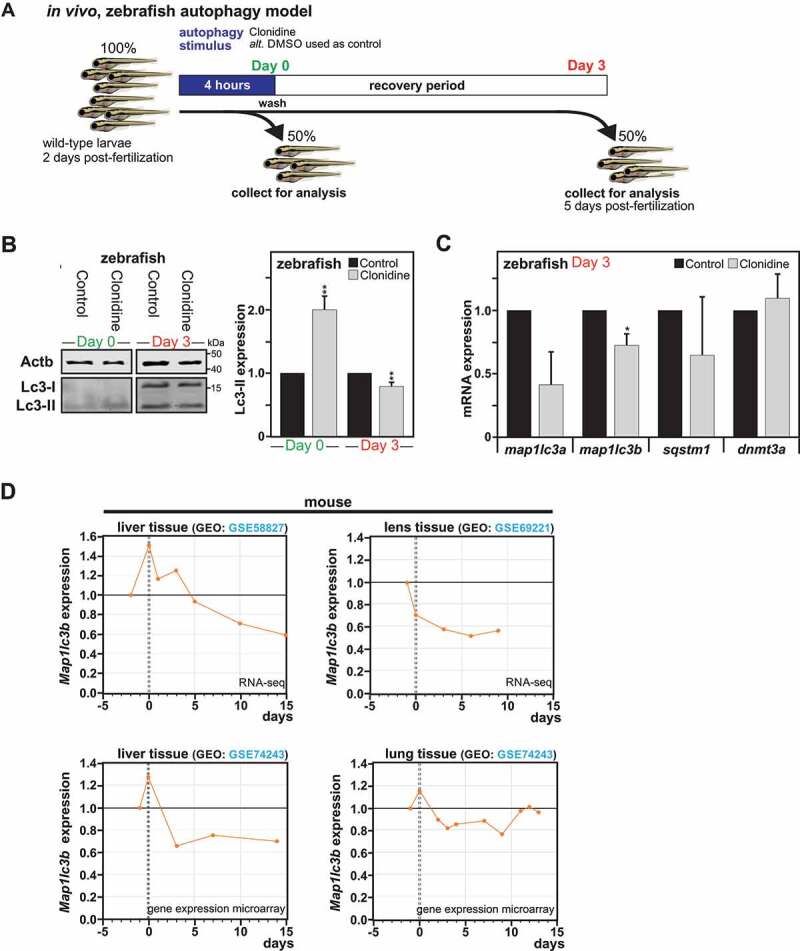
Impact of autophagy on long-term downregulation of MAP1LC3 expression in vivo. (A) Illustration of the experimental setting performed in Zebrafish larvae. (B) Representative immunoblot for LC3-II expression in Zebrafish larvae exposed for 4 h to clonidine or DMSO (used as control), collected directly after exposure (Day 0) or left to recover for 3 d. (B) Quantification of LC3-II versus ACTB expression from Zebrafish larvae at day 0 and day 3. All values are means ± SEM (n = 4, with 30 fish per condition). (C) map1lc3a, map1lc3b, sqstm1 and dnmt3a mRNA expression measured by RT-qPCR in zebrafish after the recovery period (n = 3, with 20 fish per condition). (D) Re-analysis of Map1lc3b gene expression in different mouse tissues such as liver, lens and lung before and after placenta withdrawal from 4 independent genome-wide data sets, with 0 corresponding to time of birth. All values are a means of at least 3 independent experiments ± SEM and considered significant for *p < 0.05, **p < 0.01, n.s., not significant for the indicated comparison

Acknowledgments
This image is the copyrighted work of the attributed author or publisher, and ZFIN has permission only to display this image to its users. Additional permissions should be obtained from the applicable author or publisher of the image. Full text @ Autophagy