FIGURE SUMMARY
Title

Characterization of Hspb8 in Zebrafish

Authors
Dubińska-Magiera, M., Niedbalska-Tarnowska, J., Migocka-Patrzałek, M., Posyniak, E., Daczewska, M.
Source
Full text @ Cells

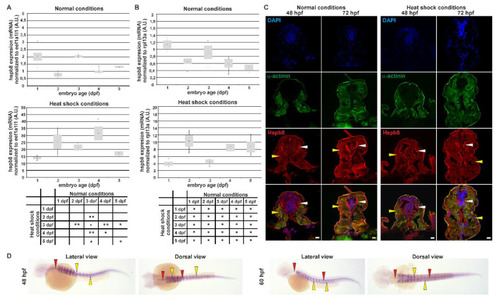
Tissue-specific expression and localization of Hspb8 during zebrafish development under normal and heat shock conditions. A and B. Real-time quantitative PCR (RT qPCR) of hspb8 mRNA expression level during zebrafish development (from 1 to 5 dpf) in normal (upper part A and B) and heat shock conditions (bottom part A and B). Expression of hspb8 mRNA was normalized to eef1a1l1 (A) and rpl13a (B). Error bars show the standard deviation. The tables below indicate the pairwise comparison between hspb8 expression level during zebrafish development (from 1 to 5 dpf) under normal and heat shock conditions. Statistically significant differences are indicated with *; * p < 0.05 and ** p < 0.001 (Student’s t-test). The experiment was performed 3 times, n = 25–30. A.U. = arbitrary unit. (C) Cross-sections of the mid-trunk region of 48 and 72 hpf zebrafish embryos under normal and heat shock conditions. The Hspb8 (red) localizes in muscle cells (yellow arrowheads) and the lateral spinal cord (white arrowheads). α-Actinin (green) is used to show muscles. Nuclei are stained blue. Cryosection (14 μm thick). Images represent single cross-sections of the mid-trunk region (0.45 μm thick). Scale bar: 10 μm. Images were obtained with a confocal laser scanning microscope (Olympus FV1000). (D) hspb8 expression in 48 and 60 hpf zebrafish embryos under heat shock conditions, whole-mount in situ hybridization. The hspb8 mRNA localizes in muscles (yellow arrowheads) and the lateral spinal cord (red arrowheads).

Tissue-specific and subcellular localization of Hspb8 during zebrafish development. (A) Hspb8 (green) subcellular distribution in the cytoplasm of neurons (white arrowhead) in the lateral spinal cord. Actin detected with Fluor 546-conjugated phalloidin (red). DNA was stained with DAPI (blue) in the lateral sections of the mid-trunk region of 72 hpf zebrafish embryos. Scale bar: 5 μm. (B) Hspb8 subcellular distribution in muscle fiber of 120 hpf zebrafish larvae. Left: 3D reconstruction (Imaris) of Hspb8 (light blue) and α-actinin (green, a marker of Z-line). Right: Localization of Hspb8 (red) and α-actinin (green) in muscle fiber of 120 hpf zebrafish larvae. Small arrowhead indicates M-line, large arrowhead indicates Z-line. Images were obtained with a confocal laser scanning microscope (Olympus FV1000). Cryosection (14 μm thick). Images represent the single Z-section (0.45 μm thick). (C) Hspb8 (red) is present in both white and slow muscles (white arrowhead). The slow muscle was detected using the F59 antibody (green) and actin with Fluor 546-conjugated phalloidin (light blue) in the cross-sections of the mid-trunk region of 120 hpf zebrafish embryo. Scale bar: 10 μm.

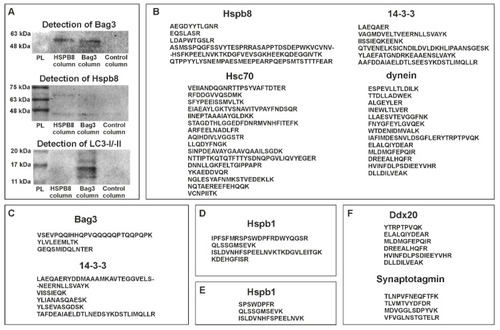
Protein partners of zebrafish Hspb8. (A) Western blot analysis of co-immunoprecipitation (co-IP) assay results. Each experiment involved the use of three columns: the first containing resin with an immobilized anti-Hspb8 antibody, the second an immobilized anti-Bag3 antibody, and the third only resin was used as a negative control. Hspb8 and Bag3 interact with each other. Moreover, Bag3 interacts with LC3 I/II. (B) and (C), List of peptides representing proteins involved in the formation of the autophagy-inducing complex detected by LC-MS analysis of eluates obtained from the co-IP experiment conducted using the column with an immobilized anti-Bag3 antibody (B), anti-Hspb8 antibody (C). (D) and (E), List of peptides representing Hspb1 detected by LC-MS analysis of eluates obtained from the co-IP experiment conducted using the column with an immobilized anti-Bag3 antibody (D) and anti-Hspb8 antibody (E). (F) List of peptides representing neuronal proteins detected by LC-MS analysis of eluates obtained from the co-IP experiment conducted using the column with an immobilized anti-Hspb8 antibody.

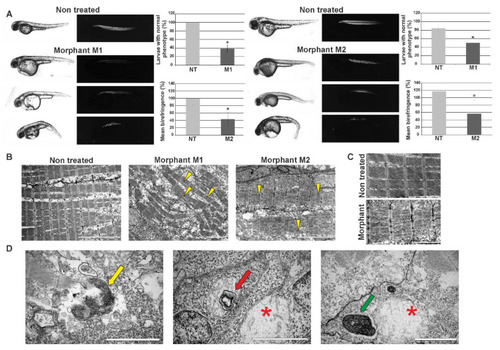
Effects of morpholino-mediated knockdown of zebrafish hspb8 on zebrafish embryo morphology and muscle structure. The effect of hspb8 knockdown was obtained through injections of morpholino oligonucleotides. 48 hpf zebrafish morphants (M1 and M2) were compared with control embryos (NT, non-treated). (A) The upper part of the panel shows representative images taken in normal light (the changes in morphology such as curved body, altered tail region, and pericardial edema are visible) and images presenting birefringence obtained in polarized light (Leica DM5000 light microscope, Leica, Munich Germany). The bottom part of the panel shows the phenotype quantification and its statistical evaluation. The phenotype quantification was conducted based on embryos morphology and their trunk muscle birefringence. The number of individuals in the control group (NT) with normal phenotype was taken as 100%. The analysis revealed that the differences between morphants (M1, M2) and control (NT) groups are statistically significant (indicated by an asterisk). The phenotype observed in over 50% of morphants was manifested in differences in body size and shape, particularly in the tail part. Moreover, pericardial edema, which is a consequence of abnormal accumulation of fluid in the pericardial cavity, occurred. The quantification of trunk muscle birefringence of individuals in the control group (NT) was taken as 100%. Statistical analyses were performed using Student’s t-test, p < 0.05, n = 20–15 in each group; each experiment was repeated at least three times. Asterisks (*) indicate significantly different groups. Error bars show the standard deviation. (B) Ultrastructural analysis of morphants’ (M1, M2) and control embryos’ (NT) muscle. Note the disruption of sarcomere organization in morphants’ muscles. The disruption is manifested as the appearance of gaps between filaments within the sarcomere (yellow arrowheads). Scale bar: 5 μm. (C) Magnified regions of sarcomeres in muscles of morphant and control individuals (non-treated). Note the disruption of sarcomere organization and accumulation of glycogen granules in morphants’ muscles. Scale bar: 2 μm. (D) Ultrastructural analysis of structures present in morphants’ muscles. The membrane-bound autophagosomes containing glycogen (yellow arrow); mitochondrion with mitochondrial vacuolization (red arrow) in the vicinity of the swollen mitochondrion (red asterisk); structure built of a whorl-like inner membrane (green arrow) in the vicinity of a swollen mitochondrion (red asterisk). Scale bar: 0.5 μm.

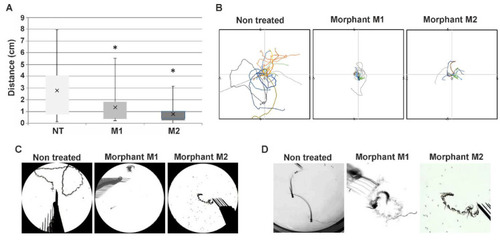
Altered swimming behavior in zebrafish embryos with decreased hspb8 level. (A) Box plot represents distribution of swimming distances in the touch-evoked response (TER) assay, measured in cm; NT: non-treated embryos (n = 86); M1 (n = 28) and M2 (n = 75) morphants: embryos after hspb8 knockdown using, respectively, morpholino oligonucleotides (MO) 1 and 2. Statistical analyses were performed using ANOVA followed by the Games–Howell post hoc test, p < 0.05; each experiment was repeated at least three times. Asterisks (*) indicate significantly different groups. Error bars show the standard deviation. (B) The colored lines demonstrate video recorded tracks of swim trajectories of individual embryos (n = 10) stimulated to move by a physical touch to the head. (C) Representative traces of individual swimming episodes of investigated embryos showing the typical (in the case of the non-treated group) and abrupt (in the case of M1 and M2 morphants) trajectories. (D) Magnified view of traces of individual swimming episodes of investigated embryos showing the typical (in the case of the non-treated group) and abrupt (in the case of M1 and M2 morphants) trajectories.

Acknowledgments
This image is the copyrighted work of the attributed author or publisher, and ZFIN has permission only to display this image to its users. Additional permissions should be obtained from the applicable author or publisher of the image. Full text @ Cells