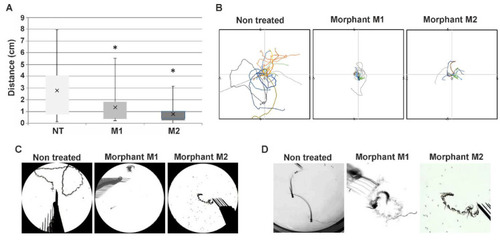
Altered swimming behavior in zebrafish embryos with decreased hspb8 level. (A) Box plot represents distribution of swimming distances in the touch-evoked response (TER) assay, measured in cm; NT: non-treated embryos (n = 86); M1 (n = 28) and M2 (n = 75) morphants: embryos after hspb8 knockdown using, respectively, morpholino oligonucleotides (MO) 1 and 2. Statistical analyses were performed using ANOVA followed by the Games–Howell post hoc test, p < 0.05; each experiment was repeated at least three times. Asterisks (*) indicate significantly different groups. Error bars show the standard deviation. (B) The colored lines demonstrate video recorded tracks of swim trajectories of individual embryos (n = 10) stimulated to move by a physical touch to the head. (C) Representative traces of individual swimming episodes of investigated embryos showing the typical (in the case of the non-treated group) and abrupt (in the case of M1 and M2 morphants) trajectories. (D) Magnified view of traces of individual swimming episodes of investigated embryos showing the typical (in the case of the non-treated group) and abrupt (in the case of M1 and M2 morphants) trajectories.
|
