IMAGE

Figure 2

ID
ZDB-IMAGE-200724-28
Source
Figures for Dubińska-Magiera et al., 2020
Image
Figure Caption

Figure 2

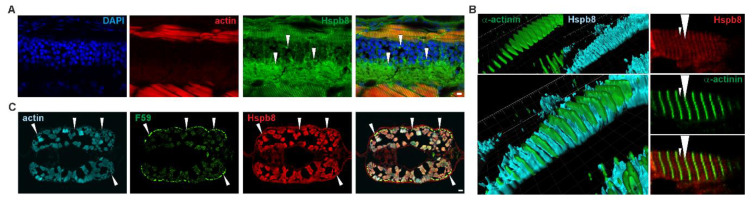
Tissue-specific and subcellular localization of Hspb8 during zebrafish development. (A) Hspb8 (green) subcellular distribution in the cytoplasm of neurons (white arrowhead) in the lateral spinal cord. Actin detected with Fluor 546-conjugated phalloidin (red). DNA was stained with DAPI (blue) in the lateral sections of the mid-trunk region of 72 hpf zebrafish embryos. Scale bar: 5 μm. (B) Hspb8 subcellular distribution in muscle fiber of 120 hpf zebrafish larvae. Left: 3D reconstruction (Imaris) of Hspb8 (light blue) and α-actinin (green, a marker of Z-line). Right: Localization of Hspb8 (red) and α-actinin (green) in muscle fiber of 120 hpf zebrafish larvae. Small arrowhead indicates M-line, large arrowhead indicates Z-line. Images were obtained with a confocal laser scanning microscope (Olympus FV1000). Cryosection (14 μm thick). Images represent the single Z-section (0.45 μm thick). (C) Hspb8 (red) is present in both white and slow muscles (white arrowhead). The slow muscle was detected using the F59 antibody (green) and actin with Fluor 546-conjugated phalloidin (light blue) in the cross-sections of the mid-trunk region of 120 hpf zebrafish embryo. Scale bar: 10 μm.

Acknowledgments
This image is the copyrighted work of the attributed author or publisher, and ZFIN has permission only to display this image to its users. Additional permissions should be obtained from the applicable author or publisher of the image. Full text @ Cells