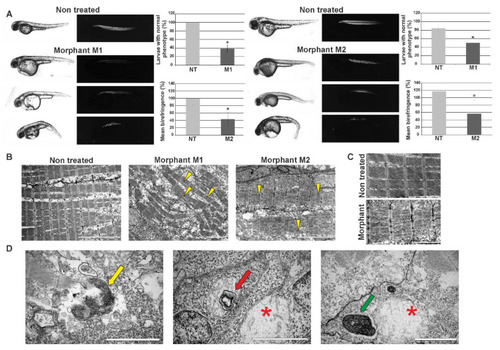
Effects of morpholino-mediated knockdown of zebrafish hspb8 on zebrafish embryo morphology and muscle structure. The effect of hspb8 knockdown was obtained through injections of morpholino oligonucleotides. 48 hpf zebrafish morphants (M1 and M2) were compared with control embryos (NT, non-treated). (A) The upper part of the panel shows representative images taken in normal light (the changes in morphology such as curved body, altered tail region, and pericardial edema are visible) and images presenting birefringence obtained in polarized light (Leica DM5000 light microscope, Leica, Munich Germany). The bottom part of the panel shows the phenotype quantification and its statistical evaluation. The phenotype quantification was conducted based on embryos morphology and their trunk muscle birefringence. The number of individuals in the control group (NT) with normal phenotype was taken as 100%. The analysis revealed that the differences between morphants (M1, M2) and control (NT) groups are statistically significant (indicated by an asterisk). The phenotype observed in over 50% of morphants was manifested in differences in body size and shape, particularly in the tail part. Moreover, pericardial edema, which is a consequence of abnormal accumulation of fluid in the pericardial cavity, occurred. The quantification of trunk muscle birefringence of individuals in the control group (NT) was taken as 100%. Statistical analyses were performed using Student’s t-test, p < 0.05, n = 20–15 in each group; each experiment was repeated at least three times. Asterisks (*) indicate significantly different groups. Error bars show the standard deviation. (B) Ultrastructural analysis of morphants’ (M1, M2) and control embryos’ (NT) muscle. Note the disruption of sarcomere organization in morphants’ muscles. The disruption is manifested as the appearance of gaps between filaments within the sarcomere (yellow arrowheads). Scale bar: 5 μm. (C) Magnified regions of sarcomeres in muscles of morphant and control individuals (non-treated). Note the disruption of sarcomere organization and accumulation of glycogen granules in morphants’ muscles. Scale bar: 2 μm. (D) Ultrastructural analysis of structures present in morphants’ muscles. The membrane-bound autophagosomes containing glycogen (yellow arrow); mitochondrion with mitochondrial vacuolization (red arrow) in the vicinity of the swollen mitochondrion (red asterisk); structure built of a whorl-like inner membrane (green arrow) in the vicinity of a swollen mitochondrion (red asterisk). Scale bar: 0.5 μm.
|
