Generation of capn3b null mutant allele. a Generation of the capn3bΔ19Δ14 mutant allele. Upper panel: diagram showing the genomic structure of the zebrafish capn3b gene and the two mutated sites in capn3bΔ19Δ14 generated by TALEN and CRISPR-Cas9 approaches, respectively. Vertical bar: exon; line connecting vertical bar: intron. Lower panel: highlighting the 19 bp deletion (red letters) in 1st exon generated by the TALEN approach (on the left) and 14 bps deletion (red letters) in 3rd exon by the CRISPR-Cas9 approach (on the right), respectively. The position of nucleotide in the capn3b open reading frame (ORF) from the translation start codon ATG is provided. C120, Capn3b activity center. b Predicted peptide encoded by the capn3bΔ19 (∆19) and capn3bΔ19Δ14 (Δ19Δ14) mutant mRNA, respectively. The Δ19 mutation leads to an early stop codon in the capn3b ORF and resulted in a 30 amino acids (aa) long polypeptide, however, the Δ19 mutation potentially allows the ATG codon encoding M94 residue of WT Capn3b to be used as an alternative translation start codon to translate an N-terminus truncated peptide which harbors the activity center C120. The Δ19Δ14 mutation creates a new early stop codon in the presumed variant initiated from M94 after C120, therefore, capn3bΔ19Δ14 is likely a null allele. c Western blotting analysis of Capn3b in WT, capn3b capn3bΔ19Δ14, capn3bΔ19 at 5dpf. β-Actin: loading control. d Immunostaining of Capn3b in WT and capn3bΔ19Δ14 mutant embryos at 5dpf. Scale bar: 50 μm

EXPRESSION / LABELING:
Gene:
Antibody:
Fish:
Anatomical Term:
Stage: Day 5
PHENOTYPE:
Fish:
Observed In:
Stage: Day 5

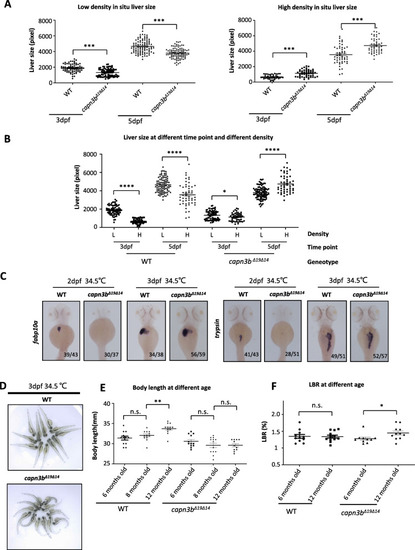
Defective development of capn3b mutant zebrafish under environment stress. a, b WISH using the fabp10a probe on 3dpf- and 5dpf-old WT and capn3bΔ19Δ14 embryos grown at the low (60 embryo/dish) (left panel) and high (120cm2/dish) (right panel) rearing density in a 9 cm-diameter dish (a). In (b), the data of liver sizes were compared between 3dpf- and 5dpf-old WT or between 3dpf- and 5dpf-old capn3bΔ19Δ14 mutant embryos under low (L) and high (H) rearing intensity. c WISH using the fabp10a and trypsin probes on WT and capn3bΔ19Δ14 embryos at 2dpf and 3dpf. Embryos were shifted to 34.5 °C at 12 hpf till the time of sample harvesting. Numerator/denominator: number of embryos displayed the shown phenotype over total number of genotyped embryos. d Photo images showing the curved body phenotype displayed by the 3dpf-old capn3bΔ19Δ14 mutant but not WT embryos grown at 34.5 °C. e Body lengths of 6-, 8- and 12-months-old WT and capn3bΔ19Δ14 fish. f LBR of 6- and 12-months-old WT and capn3bΔ19Δ14 fish. Student’s T-test for statistical analyses, *, p < 0.05; ***, p < 0.001; ****, p < 0.0001

Delayed hepatocyte proliferation in capn3bΔ19Δ14 at the resection site after PH. a, b Comparison of LBRs at 3-, 7- and 30-dpH in WT and capn3bΔ19Δ14 fish operated at the age of 8-months-old (a) or16-months-old (b). Sham control: cut through the abdominal skin only. c-f Co-staining of EdU and Bhmt (liver marker) at the wounding site of the liver in WT and capn3bΔ19Δ14 fish at 3dpH (c) and 7dpH (e). Red dashed line: outlining the cutting site. DAPI: staining nuclei. Scale bar: 50 μm. Corresponding statistical data of the EdU-positive cells were provided (d, 3dpH; f, 7dpH). EdU was injected 24 h before harvesting at 3dpH or 7dpH. Three sections per fish and total three fish were evaluated for each genotype in each case. Student’s T-test for statistical analyses, *, p < 0.05; **, p < 0.01

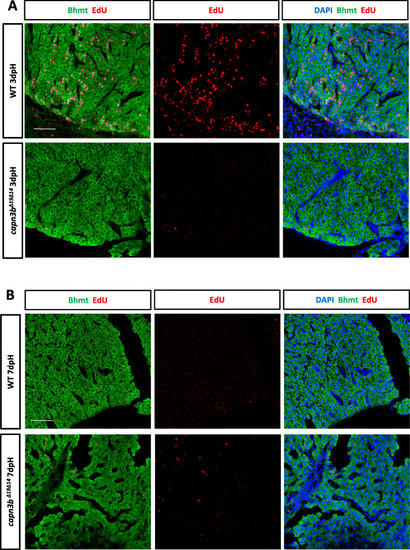
Delayed hepatocyte proliferation in capn3bΔ19Δ14 in the deeper region after PH. a, b Co-staining of EdU and Bhmt (hepatocyte marker) for analyzing proliferating hepatocytes in the deeper region away from the amputated site in WT and capn3bΔ19Δ14 at 3dpH (a) and 7dpH (b). DAPI: staining nuclei

Clustering analysis of the mass spectrometry data of nuclear proteins from WT and capn3bΔ19Δ14 samples. a Western blot analysis of protein in the isolated nuclei from WT sham, WT PH, capn3bΔ19Δ14 sham and capn3bΔ19Δ14 PH, three repeats for each group, for each repeat the livers from eight female fish were used. b Heat map clustering analysis of three independent WT sham samples (WT-1S, WT-2S, WT-3S) and three independent capn3bΔ19Δ14 mutant sham samples (3b-1S, 3b-2S, 3b-3S) (left panel), and of three independent WT PH samples (WT-1P, WT-2P, WT-3P) and three independent capn3bΔ19Δ14 mutant PH samples (3b-1P, 3b-2P, 3b-3P) (right panel). Each repeat contained nuclear proteins extracted from 8 female fish. c Heat map clustering analysis of WT-1S, WT-3S, 3b-1S and 3b-2S (left panel), and of WT-1P, WT-3P, 3b-1P, 3b-2P (right panel)

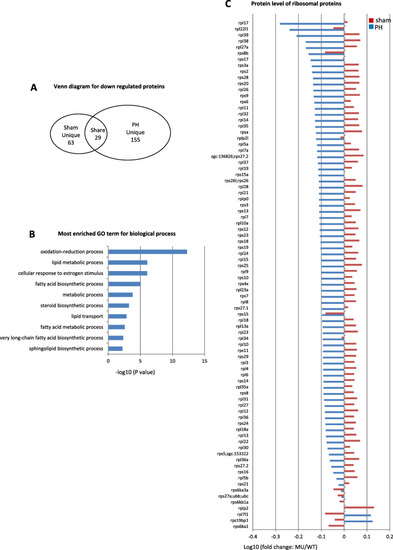
Down-regulation of proteins related to lipid metabolism and ribosomal function in capn3bΔ19Δ14 at 3dpH. a Venn diagram showing the number of ‘Sham unique’, ‘PH unique’ and ‘Shared’ proteins down-regulated in capn3bΔ19Δ14 (cutoff value: WT/MU > 1.45). b Top 10 categories obtained from GO analysis of biological process for the 155 uniquely downregulated proteins in capn3bΔ19Δ14 at 3dpH. c Comparison of the change (in log10 value of the ratio of MU/WT) of 84 ribosomal proteins between the PH-group and sham-group at 3dpH

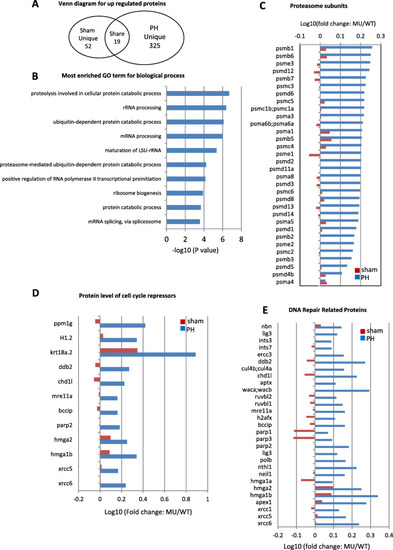
Up-regulation of proteins related to 26S proteasome and cell cycle arrest in capn3bΔ19Δ14 at 3dpH. a Venn diagram showing the number of ‘Sham unique’, ‘PH unique’ and ‘Shared’ proteins up-regulated in capn3bΔ19Δ14 (cutoff value: MU/WT > 1.45). b Top 10 categories obtained from GO analysis of biological process for the 325 uniquely up-regulated proteins in capn3bΔ19Δ14 at 3dpH. c-e Comparison of the change (in log10 value of the ratio of MU/WT) of 32 26S proteasome subunits (c), 12 cell cycle negative regulators (d) and 29 DNA-repair related proteins (e) between the PH-group and sham-group at 3dpH

Chk1 and Wee1 are substrates of the Def-Capn3b complex. a Diagram showing the Capn3 recognition motif (left panel) and the locations of this motif in zebrafish, human and mouse Chk1 (middle panel) and Wee1 (right panel) proteins. b, c Western blot of Def, HA-p53R143H, HA-Chk1 and HA-Wee1S44A in WT embryos injected with HA-p53R143H, HA-Chk1 or HA-Wee1S44A mRNA combined with or without def mRNA (b). Western blot of HA-Chk1 and HA-Chk1Δ in WT embryos injected with HA-Chek1or HA-Chek1Δ mRNA combined with or without def mRNA (c). Total proteins were extracted at 8-h post-injection. β-Actin: loading control. d Western blot of the endogenous Chk1 and Wee1 proteins in WT and def−/− mutant embryos at 5dpf. Tubulin: loading control. e, f Co-immunostaining of Chk1 (e) or Wee1 (F) with Fibrillarin in the liver of WT with def−/− at 5dpf. DAPI: stain nuclei

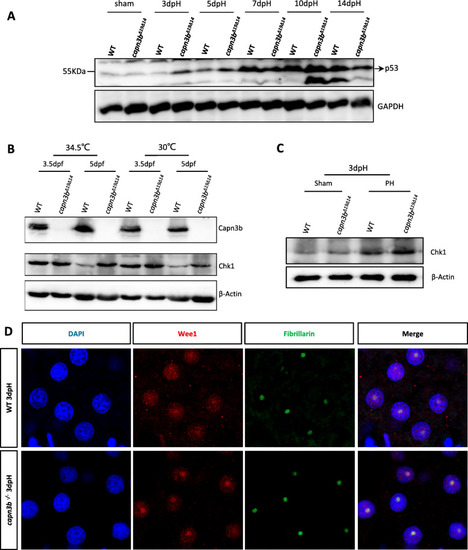
Hepatic accumulation of Chk1 and Wee1 in capn3bΔ19Δ14 at 3dpH. a Elevation of p53 protein level in capn3bΔ19Δ14 after PH. Western blot analysis of p53 at different time point after PH as indicated. Total proteins were extracted from the liver tissues of sham, 3dpH, 5dpH, 7dpH, 10dpH and 14dpH, respectively. GAPDH, loading control. b Western blot of Capn3b and Chk1 in WT and capn3bΔ19Δ14 mutant embryos at 3.5dpf and 5dpf grown at 30 °C and 34.5 °C, respectively. The embryos were shifted to 34.5 °C at 12hpf till the time of harvesting. β-Actin: loading control. c Western blot of Chk1 in WT and capn3bΔ19Δ14 sham and PH groups at 3dpH group. Fibrillarin: loading control. d Co-immunostaining of Wee1 and Fibrillarin in the liver of WT and capn3bΔ19Δ14 mutant fish at 3dpH. DAPI: staining nuclei

Acknowledgments
This image is the copyrighted work of the attributed author or publisher, and ZFIN has permission only to display this image to its users. Additional permissions should be obtained from the applicable author or publisher of the image. Full text @ Cell Regen (Lond)