
IMAGE
Fig. 6
- ID
- ZDB-IMAGE-200629-23
- Publication
- Chen et al., 2020 - Capn3 depletion causes Chk1 and Wee1 accumulation and disrupts synchronization of cell cycle reentry during liver regeneration after partial hepatectomy
- All Figures
- Figures for Chen et al., 2020
Image
|
Figure Caption
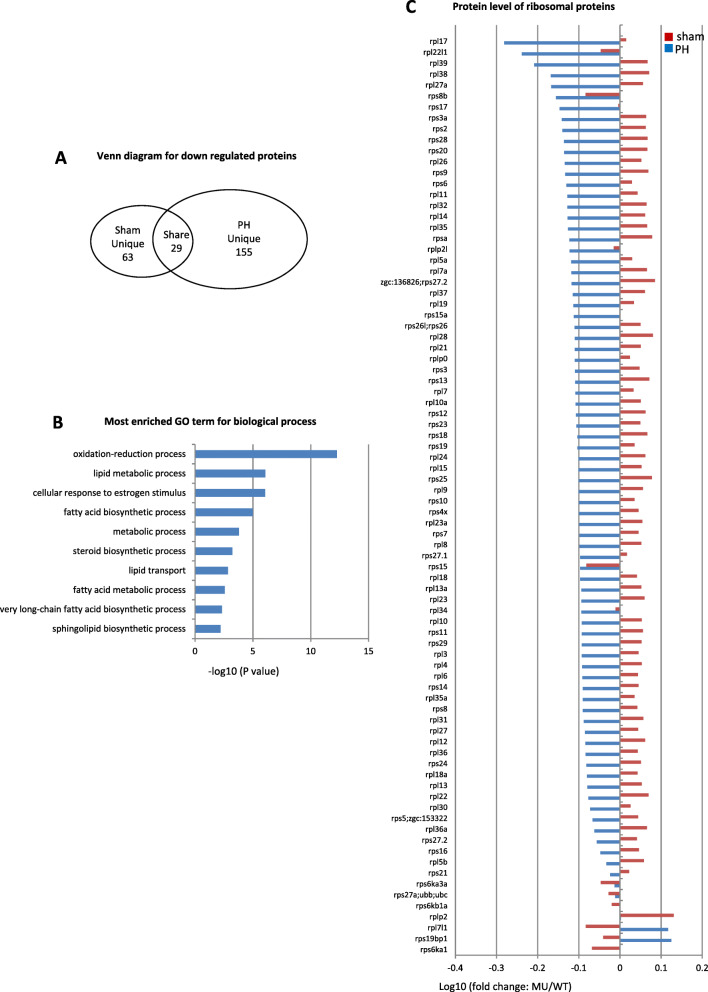
Fig. 6
Down-regulation of proteins related to lipid metabolism and ribosomal function in
Acknowledgments
This image is the copyrighted work of the attributed author or publisher, and
ZFIN has permission only to display this image to its users.
Additional permissions should be obtained from the applicable author or publisher of the image.
Full text @ Cell Regen (Lond)