FIGURE SUMMARY
Title

Human ARF Specifically Inhibits Epimorphic Regeneration in the Zebrafish Heart

Authors
Lee, S., Hesse, R., Tamaki, S., Garland, C., Pomerantz, J.H.
Source
Full text @ Genes (Basel)

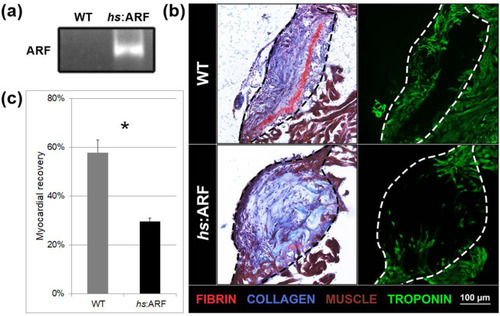
Induced Alternative Reading Frame (ARF) expression in hs:ARF fish suppresses cardiac regeneration. (a) Representative polymerase chain reaction (PCR) product of ARF expression from three experimental replicates of wild type (WT) and hs:ARF heart RNA on 15 dpi. The product run on gel electrophoresis shows ARF expression present in hs:ARF fish while absent in WT fish. (b) Acid Fuchsin Orange G (AFOG) and troponin staining of WT and hs:ARF heart cryosections on 15 days post-injury (dpi). The dotted lines demarcate the injury site. Red stains are for fibrin. Blue stains are for collagen. Brown stains are for muscle. Green stains are for troponin. (c) Myocardial recovery measured by troponin infiltration into the injury site. Infiltration quantified by imaging software shows decreased troponin in the injury site of hs:ARF fish compared to WT fish. N = 8 hearts. Results are shown as mean ± standard error. The * represents a statistically significant difference.

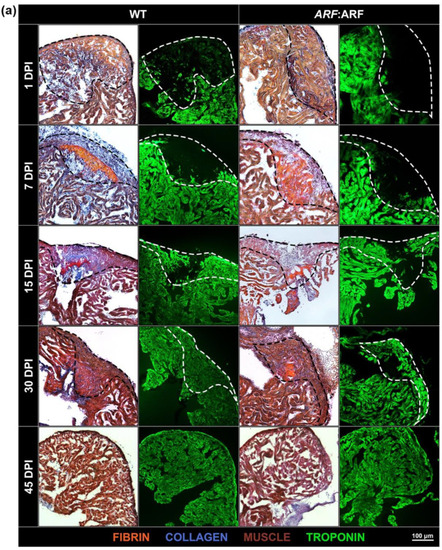
ARF expressed under control of the endogenous human ARF promoter in ARF:ARF fish suppresses cardiac regeneration over time. (a) AFOG and troponin staining of WT and ARF:ARF heart cryosections at 1, 7, 15, and 30 dpi. The dotted lines demarcate the injury site. Red stains are for fibrin. Blue stains are for collagen. Brown stains are for muscle. Green stains are for troponin. (b) Myocardial recovery measured by troponin infiltration into the injury site. Infiltration quantified by imaging software shows decreased troponin in the injury site of ARF:ARF fish compared to WT fish from 7 dpi onward. N = 49 hearts. The grey and black lines are logarithmic approximations of the WT and ARF:ARF heart recovery trends respectively. Results are shown as mean ± standard error. The * represents a statistically significant difference.

ARF expressed under control of the endogenous human ARF promoter in ARF:ARF fish suppresses cardiac regeneration over time. (a) AFOG and troponin staining of WT and ARF:ARF heart cryosections at 1, 7, 15, and 30 dpi. The dotted lines demarcate the injury site. Red stains are for fibrin. Blue stains are for collagen. Brown stains are for muscle. Green stains are for troponin. (b) Myocardial recovery measured by troponin infiltration into the injury site. Infiltration quantified by imaging software shows decreased troponin in the injury site of ARF:ARF fish compared to WT fish from 7 dpi onward. N = 49 hearts. The grey and black lines are logarithmic approximations of the WT and ARF:ARF heart recovery trends respectively. Results are shown as mean ± standard error. The * represents a statistically significant difference.

ARF expressed in ARF:ARF fish suppresses cardiomyocyte proliferation. (a) Myocyte enhancer factor 2 (Mef2), proliferating cell nuclear antigen (PCNA), and 4′,6-diamidino-2-phenylindole (DAPI) staining in WT and ARF:ARF fish at 11 dpi. Blue stains are for all nuclei. Red stains are for Mef2, a cardiomyocyte nuclear marker. Green stains are for PCNA, a cell cycling marker. (b) The cardiomyocyte (CM) proliferation index shows decreased cardiomyocyte cycling in ARF:ARF fish. The CM proliferation index was calculated by counting Mef2+/PCNA+ cells out of total Mef2+ cells in the injury zone. N = 8 hearts. Results are shown as mean ± standard error. The * represents a statistically significant difference.

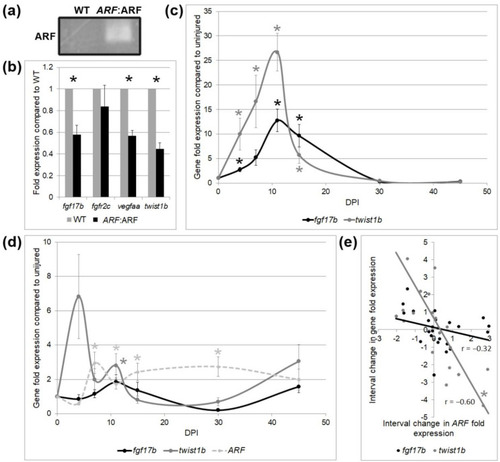
Tissue-specific gene expression by qPCR in WT and ARF:ARF fish over time. (a) Representative PCR product of ARF expression from three experimental replicates of WT and ARF:ARF heart RNA. The product run on gel electrophoresis shows ARF expression present in ARF:ARF fish while absent in WT fish at 11 dpi. (b) qPCR of fibroblast growth factor 17b (fgf17b), fibroblast growth factor receptor 2c (fgfr2c), vascular endothelial growth factor Aa (vegfaa), and twist1b mRNA expression for WT and ARF:ARF fish at 11 dpi. Results show a significant decrease in the expression of fgf17b, vegfaa, and twist1b in ARF:ARF fish. No significant difference occurred for fgfr2c. N = 8 hearts. (c) fgf17b and twist1b mRNA expression for WT fish over time compared to uninjured WT control. fgf17b and twist1b rise steadily after cryoinjury and peak by 11 dpi before tapering down to the uninjured baseline by 30 dpi. N = 18 hearts. (d) fgf17b, twist1b, and ARF mRNA expression for ARF:ARF fish over time compared to uninjured ARF:ARF control. ARF is significantly elevated above the uninjured baseline from 7–30 dpi. fgf17b is never elevated above the uninjured baseline. twist1b expression is only elevated above the uninjured baseline on 11 dpi. N = 24 hearts. (e) Correlation between interval change in ARF expression with changes in fgf17b and twist1b expression at any time point. ARF expression trended toward inverse correlation with fgf17b expression and was inversely correlated with twist1b expression. N = 24 hearts. Results are shown as mean ± standard error. The * represents a statistically significant difference.

EXPRESSION / LABELING:
Genes:
Fish:
Anatomical Term:
Stage: Adult
PHENOTYPE:
Fish:
Observed In:
Stage: Adult
Acknowledgments
This image is the copyrighted work of the attributed author or publisher, and ZFIN has permission only to display this image to its users. Additional permissions should be obtained from the applicable author or publisher of the image. Full text @ Genes (Basel)