Toxoplasma gondii tachyzoites are intracellular and replicate in zebrafish. (A) Representative images from AiryScan confocal imaging of replicating tachyzoites in fixed larvae infected in the HBV with type I Toxoplasma-GFP at 6 and 24 hpi, showing 1, 2 or >4 tachyzoites/vacuole. Scale bar: 2 µm. (B) Pixel volume quantification of individual GFP-positive punctae at 6 and 24 hpi. Significant differences (χ22=58.5, ***P≤0.001) were observed between the percentage of total vacuoles counted in the HBV that are 1 tachyzoite/vacuole (<50 pix3), 2 tachyzoites/vacuole (50<100 pix3) or >4 tachyzoites/vacuole (>100 pix3) at 6 and 24 hpi. Pooled data from three independent experiments with at least three larvae per time point. Mean±s.e.m. shown. p.i., post-infection. (C) Representative AiryScan confocal images of replicating tachyzoites in larvae infected in the HBV with type I Toxoplasma-GFP (green; top-left images), fixed at 0, 6 and 24 hpi and labeled with α-GRA2 (red; top-right images) and merge (bottom large images). Shown are 1, 2 or >4 tachyzoites/vacuole. Scale bars: 2 µm.
Toxoplasma gondii tachyzoites reside within zebrafish brain cells and neurons. (A) 3D CLEM of tachyzoites in the HBV of transgenic mpeg1:G/U:mCherry larvae harboring macrophages (red) infected with type I Toxoplasma-GFP (green) at 6 hpi. 3D reconstructions of 40 confocal z-slices of a full vibratome section (FM, fluorescence microscopy; top left) and of 354 inverted consecutive 50 nm SBF SEM slices of a segment of it (top right). A middle slice of each of the Toxoplasma visible in the SBF SEM dataset was manually segmented (green; top right) to aid correlation. Regions of interest showing the localization of the high-resolution SBF SEM images (bottom row) are denoted with color boxes. Single (left; green box), replicating (middle; red box) and doublet (right; blue box) tachyzoites in zebrafish host cells were observed. See also Movie 2. Shown are three representative images out of 36 total Toxoplasma in zebrafish brain cells (see Fig. S2); tachyzoites were imaged in their whole volume to accurately determine their stage. Host mitochondrial recruitment to the parasitophorous vacuole is indicated by yellow arrowheads. Scale bars: 10 µm (top row) and 1 µm (bottom row). (B) Representative AiryScan confocal images of 3 dpf Tg(elavl3:GCaMP6 s)jf4 larvae (neurons marked in green) infected in the HBV with type I Toxoplasma-Tomato (red) at 4 hpi. Shown are maximum projections of 35 z-slices (covering 5.98 µm) out of 85 slices imaged (left, five tachyzoites total imaged). The ventricular surface is highlighted by a white dashed line. Of the three tachyzoites found within green neurons from the left image, shown are magnified maximum-projection images of two tachyzoites covering 8 (i, top right) or 17 (ii, bottom right) z-slices (z=0.17 µm) out of 85 total. Scale bars: 5 µm (left image) and 2 µm (right images). Two of the five tachyzoites imaged are not inside green neurons (left) and close to the ventricular surface where green neurons become sporadic (see Movie 3), which suggests active invasion of progenitors/ependymal cells.
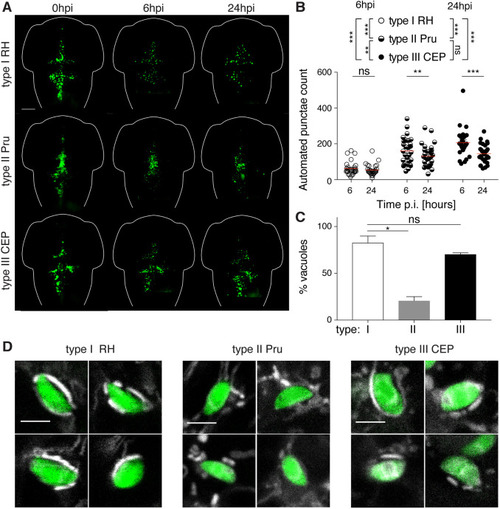
Non-lethal zebrafish larvae model of acute Toxoplasma gondii infection. (A) Representative images of larvae infected in the HBV with type I (RH; top row), type II (Pru; middle row) or type III (CEP; bottom row) of Toxoplasma (green). Individual larvae were imaged and monitored at 0, 6 and 24 hpi by fluorescent stereomicroscopy. Scale bar: 100 µm. (B) Automated enumeration of GFP-positive punctae at 6 hpi and 24 hpi of larvae infected with type I (RH; open circles), type II (Pru; semi-closed circles) or type III (CEP; closed circles) of Toxoplasma tachyzoites. Automated counts were supported by manual quantifications (Fig. S3C). Mean±s.e.m. shown. Pooled data from at least three independent experiments with at least five larvae per condition per experiment. Significance calculated using two-way ANOVA (repeated measures) with Sidak's multiple comparisons test. ns, P>0.05; **P≤0.01, ***P≤0.001. p.i., post-infection. (C) Quantification of the percentage of type I (white bar), type II (gray bar) or type III (black bar) vacuoles exhibiting host mitochondrial association at 6 hpi in the zebrafish hindbrain. Significant differences were observed between the parasite strains (Kruskal–Wallis P=0.0036), with type II parasites shown to be lower (20±4.3%) than type I (82±7.2%) or type III (70±1.6%) parasites. Significance calculated using Dunn's multiple comparisons test. ns, P>0.05; *P≤0.05. Pooled data from at least three independent experiments with three larvae per condition per experiment. Mean±s.e.m. shown. (D) Representative confocal images of larvae infected in the HBV with type I (RH; left panels), type II (Pru; middle panels) or type III (CEP; right panels) of Toxoplasma (green) and stained for mitochondria (white) at 6 hpi, showing four examples each of host mitochondrial recruitment (for type I and type III) or no host mitochondrial recruitment (for type II). Scale bars: 5 µm.
Leukocyte recruitment to Toxoplasma gondii in vivo. (A) Representative images of mpeg1:G/U:mCherry larvae harboring macrophages (red) infected in the HBV with Toxoplasma (green). Individual larvae were imaged and monitored at 0, 6 and 24 hpi by fluorescent stereomicroscopy. Scale bar: 100 µm. (B) Quantification of macrophages in mpeg1:G/U:mCherry larvae at 0, 6 and 24 hpi injected with mock [human foreskin fibroblast (HFF) lysate; gray open circles], type I (RH; open circles), type II (Pru; semi-closed circles) or type III (CEP; closed circles) parasites. Pooled data from at least three independent experiments with at least seven larvae per condition per experiment. Mean±s.e.m. shown. Significance calculated using two-way ANOVA (repeated measures) with Sidak's multiple comparisons test. ns, P>0.05; ***P≤0.001. p.i., post-infection. (C) Representative images of lyz:dsRed larvae harboring neutrophils (red) infected in the HBV with Toxoplasma (green). Individual larvae were imaged and monitored at 0, 6 and 24 hpi by fluorescent stereomicroscopy. Scale bar: 100 µm. (D) Quantification of neutrophils in lyz:dsRed larvae at 0, 6 and 24 hpi injected with mock (HFF lysate; gray open circles), type I (RH; open circles), type II (Pru; semi-closed circles) or type III (CEP; closed circles). Pooled data from at least two independent experiments with at least three larvae per condition per experiment. Mean±s.e.m. shown. Significance calculated using two-way ANOVA (repeated measures) with Tukey's multiple comparisons test. ns, P>0.05; *P≤0.01, **P≤0.01, ***P≤0.001.
Macrophages phagocytose and degrade Toxoplasma gondii in vivo. (A) Representative frames extracted from in vivo confocal imaging of mpeg1:G/U:mCherry larvae harboring macrophages (red) injected with type I Toxoplasma-GFP (green). First frame at 2 h 12 min post-infection (mpi) followed by seven consecutive frames taken at 8 min intervals. Shown are maximum projections of 24 z-slices taken at 2 µm optical sections. White arrowheads label a phagocytosed parasite at 2 h 20 mpi that loses its green fluorescence by 3 h 8 mpi. Yellow arrowheads indicate a new phagocytosis event of a green parasite at 3 hpi to 3 h 8 mpi. Scale bar: 10 µm. See also Movie 5. (B) 3D CLEM of dead/dying tachyzoites in the HBV of mpeg1:G/U:mCherry larvae harboring macrophages (red) infected with type I Toxoplasma-GFP (green) at 6 hpi and stained with Hoechst 33342 (blue). Representative images extracted from confocal z-stacks of a full vibratome section (left column) and from consecutive 50 nm SBF SEM slices of a segment of it (right column). Dead/dying parasites are indicated by white arrowheads (insets, left column) and outlined by green dashed lines (right column). Scale bars: 10 µm (left column) and 1 µm (right column).
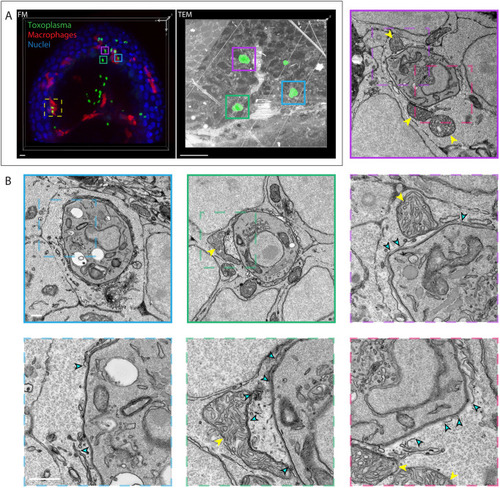
Host cell-intrinsic response in zebrafish disrupts Toxoplasma gondii parasitophorous vacuoles in brain cells in vivo. (A) 3D CLEM of tachyzoites in the HBV of transgenic mpeg1:G/U:mCherry larvae harboring macrophages (red) infected with type I Toxoplasma-GFP (green) at 6hpi and stained with Hoechst 33342 (blue). 3D reconstructions of 59 confocal z-slices (40×) of a part of the HBV (FM, fluorescence microscopy; left) and of 75 inverted consecutive 70 nm sections imaged by ssTEM at 440× magnification (right). Each of the Toxoplasma visible in the ssTEM dataset was manually segmented (green; right) in every section to aid correlation. Regions of interest showing the localization of the high-resolution ssTEM images shown in B (cyan, magenta and green boxes) and Fig. 7 (yellow dashed line box) are indicated. Scale bars: 10 µm. (B) Representative higher-magnification ssTEM images of Toxoplasma in HBV cells. Continuous line boxes show 6800× magnification images; dashed line boxes show 18,500× magnification images. Toxoplasma tachyzoites were imaged in their full volume to accurately assess the continuity of the PV. See also Movie 6. Host mitochondrial recruitment to the PV is indicated by yellow arrowheads; breaks in the PV are indicated by cyan arrowheads. Scale bars: 1 µm (continuous line box) and 500 nm (dashed line box).
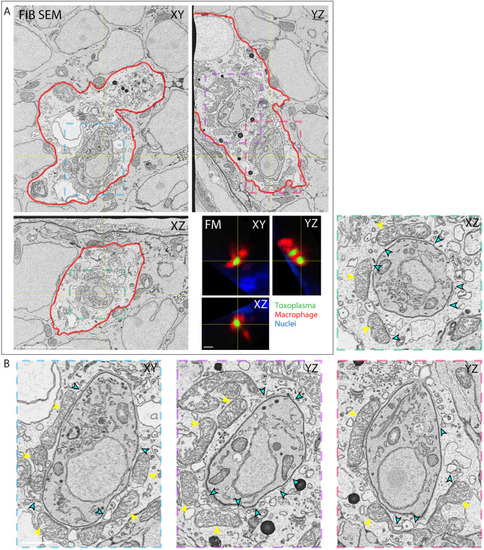
Host cell-intrinsic response disrupts Toxoplasma gondii parasitophorous vacuoles in zebrafish macrophages in vivo. (A) 3D CLEM of two parasites inside a macrophage in the HBV of mpeg1:G/U:mCherry larvae harboring macrophages (red) infected with type I Toxoplasma-GFP (green) at 6 hpi and stained with Hoechst 33342 (blue). Orthoslices of 3200 consecutive 5 nm FIB SEM slices of the whole macrophage (top left; see also Movie 7) and of 59 confocal z-slices (40×) re-sliced to match the orientation of the FIB SEM data (FM, bottom right; cell also shown in yellow dashed line box in Fig. 6A). Color boxes show localization of the cropped and enlarged images of tachyzoites shown in B. The plasma membrane of the macrophage (red) was manually segmented to aid correlation. (B) Cropped and enlarged images of the Toxoplasma shown in the FIB SEM orthoslices in A. Host mitochondrial recruitment to the PV is indicated by yellow arrowheads; breaks in the PV are indicated by cyan arrowheads. Scale bars: 5 µm (A) and 1 µm (B).
Macrophages control Toxoplasma gondii burden in vivo. (A) Representative images of control (Ctrl; top) or macrophage-ablated (Mtz; bottom) mpeg:G/U:mCherry larvae infected in HBV with type I Toxoplasma-GFP (green). Individual larvae were imaged at 6 hpi and 24 hpi by fluorescent stereomicroscopy. Scale bar: 100 µm. (B) Automated enumeration of GFP-positive punctae in the HBV at 6 hpi and 24 hpi of Ctrl (gray open circles) or macrophage-ablated (open circles) larvae infected with type I Toxoplasma tachyzoites. Pooled data from three independent experiments with at least seven larvae per condition per experiment. Significance calculated using two-way ANOVA (repeated measures) with Sidak's multiple comparisons test. ***P≤0.001. p.i., post-infection. (C) Pixel volume quantification of individual GFP-positive punctae in Ctrl or macrophage-ablated larvae at 6 hpi and 24 hpi. Presented as percentage of total vacuoles counted in the HBV that are 1 tachyzoite/vacuole (<50 pix3), 2 tachyzoites/vacuole (50<100 pix3) or >4 tachyzoites/vacuole (>100 pix3). Pooled data from three independent experiments with at least three larvae per time point. Significance calculated using Chi-square test, χ22=1.248 (6 hpi), χ22=5.4 (24 hpi). ns, P>0.05. Mean±s.e.m. shown.
Acknowledgments
This image is the copyrighted work of the attributed author or publisher, and
ZFIN has permission only to display this image to its users.
Additional permissions should be obtained from the applicable author or publisher of the image.
Full text @ Dis. Model. Mech.
Your Input Welcome
Thank you for submitting comments. Your input has been emailed to ZFIN curators who may contact you if
additional information is required.
Oops. Something went wrong. Please try again later.