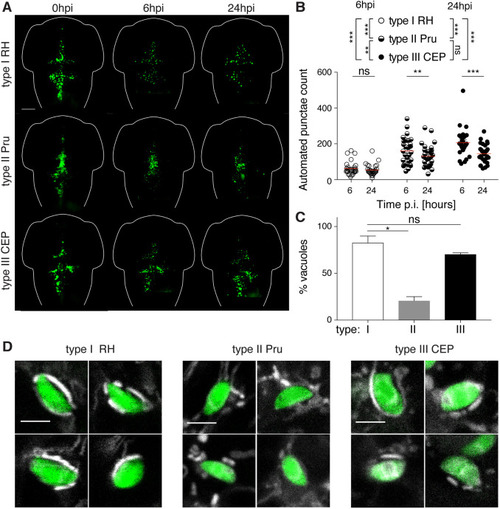
Non-lethal zebrafish larvae model of acute Toxoplasma gondii infection. (A) Representative images of larvae infected in the HBV with type I (RH; top row), type II (Pru; middle row) or type III (CEP; bottom row) of Toxoplasma (green). Individual larvae were imaged and monitored at 0, 6 and 24 hpi by fluorescent stereomicroscopy. Scale bar: 100 µm. (B) Automated enumeration of GFP-positive punctae at 6 hpi and 24 hpi of larvae infected with type I (RH; open circles), type II (Pru; semi-closed circles) or type III (CEP; closed circles) of Toxoplasma tachyzoites. Automated counts were supported by manual quantifications (Fig. S3C). Mean±s.e.m. shown. Pooled data from at least three independent experiments with at least five larvae per condition per experiment. Significance calculated using two-way ANOVA (repeated measures) with Sidak's multiple comparisons test. ns, P>0.05; **P≤0.01, ***P≤0.001. p.i., post-infection. (C) Quantification of the percentage of type I (white bar), type II (gray bar) or type III (black bar) vacuoles exhibiting host mitochondrial association at 6 hpi in the zebrafish hindbrain. Significant differences were observed between the parasite strains (Kruskal–Wallis P=0.0036), with type II parasites shown to be lower (20±4.3%) than type I (82±7.2%) or type III (70±1.6%) parasites. Significance calculated using Dunn's multiple comparisons test. ns, P>0.05; *P≤0.05. Pooled data from at least three independent experiments with three larvae per condition per experiment. Mean±s.e.m. shown. (D) Representative confocal images of larvae infected in the HBV with type I (RH; left panels), type II (Pru; middle panels) or type III (CEP; right panels) of Toxoplasma (green) and stained for mitochondria (white) at 6 hpi, showing four examples each of host mitochondrial recruitment (for type I and type III) or no host mitochondrial recruitment (for type II). Scale bars: 5 µm.
|
